Our system will evaluate the answer based on this AI-generated description.
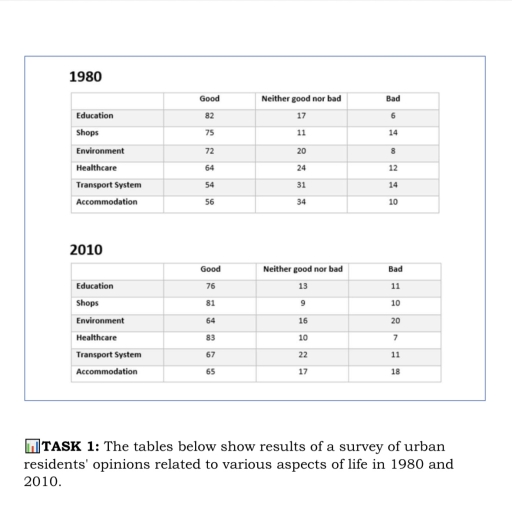
The image displays two tables of survey results for 1980 and 2010 across six categories, rated as 'Good', 'Neither good nor bad', or 'Bad'. In 1980, the figures were: Education (Good 82, Neither good nor bad 17, Bad 6), Shops (Good 75, Neither good nor bad 11, Bad 14), Environment (Good 72, Neither good nor bad 20, Bad 8), Healthcare (Good 64, Neither good nor bad 24, Bad 12), Transport System (Good 54, Neither good nor bad 31, Bad 14), and Accommodation (Good 56, Neither good nor bad 34, Bad 10). In 2010, the figures were: Education (Good 76, Neither good nor bad 13, Bad 11), Shops (Good 81, Neither good nor bad 9, Bad 10), Environment (Good 64, Neither good nor bad 16, Bad 20), Healthcare (Good 83, Neither good nor bad 10, Bad 7), Transport System (Good 67, Neither good nor bad 22, Bad 11), and Accommodation (Good 65, Neither good nor bad 17, Bad 18).
Given the complexity of the image, the above description may not be entirely accurate.
Skyrocket your IELTS band score by 1-2 points in under a month with our premium plan!
Note: Both the topic and the answer were created by one of our users.
The table illustrates the results of a survey of urban residents’ opinions regarding various aspects of life in 1980 and 2010. In general, there were six aspects that were put into comparison.
In terms of education, the overall opinion reflected that more people figure it was worse compared to 1980, with a 6 percent drop in good response. As for the aspect of shops, the percentage experienced a slight increase, which is 6 percent growth and 4 percent decline for good response and bad, respectively. As for healthcare, transport system and accommodation alike, the percentages of these categories all surged in different scales referring to good responses. It was 64% originally for healthcare, while shooting up to 83 percent; 54 percent initially for transport system, whereas going up to 67%; 56 percent for accommodation, with a major jump to 65%.
The percentage of persons showing eclectic in total plummet a lot in every category, varying from a 2% to 17% gap each category.
Word Count: 163
