🔥 Today Only: Save 30% on Premium — Offer Ends Soon! - Upgrade Now!
Table

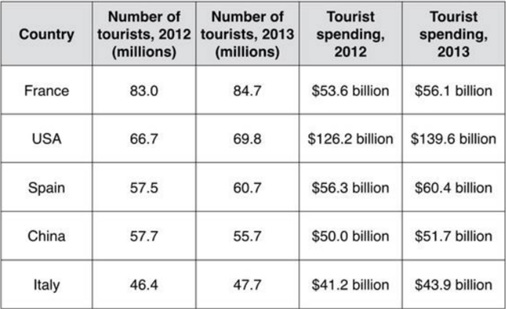
Band 5+: The table below shows statistics about the top five countries for international tourism in 2012 and 2013.

Image for topic: The table below shows statistics about the top five countries for international tourism in 2012 and 2013.
Our system will evaluate the answer based on this AI-generated description.
The image presents a table comparing five countries across four columns: Number of tourists (millions) in 2012 and 2013, and Tourist spending in 2012 and 2013. France had 83.0 million tourists in 2012 and 84.7 million in 2013, with spending at $53.6 billion in 2012 and $56.1 billion in 2013. The USA saw 66.7 million tourists in 2012 and 69.8 million in 2013, with spending increasing from $126.2 billion in 2012 to $139.6 billion in 2013. Spain had 57.5 million tourists in 2012 and 60.7 million in 2013 with spending at $56.3 billion in 2012 and $60.4 billion in 2013. China's tourists decreased from 57.7 million in 2012 to 55.7 million in 2013, with a spending increase from $50.0 billion in 2012 to $51.7 billion in 2013. Italy had 46.4 million tourists in 2012 and 47.7 million in 2013, with tourist spending of $41.2 billion in 2012 and $43.9 billion in 2013.
Given the complexity of the image, the above description may not be entirely accurate.
Note: Both the topic and the answer were created by one of our users.

The given line graph presents the energy consumption by fuel in the USA from 80s to 2030 with the projection. The units are measured in quadrillions.

Overall, the expenditure of petrol and oil has been leading the all sections by fluctuating, while that of hydropower has almost been remaining in the minimum position.

It is clearly seen that the index of petrol and oil will be soaring to approximately 50 quadrillions from 35, whereas the hydropower’s utilization might be constant with slight changes and will have been on the last place with 5 quadrillions until the end of the period. Furthermore, the indicators of nuclear and solar or wind used to have and will have the similarity by starting together from close to 5 quadrillions to over 5 quadrillions. Moreover, it can be noticed the coal and natural gas consumption will be fluctuating from over 15 quadrillions to about 25 and 30 quadrillions respectively.

Word Count: 154

Answers On The Same Topic:

The table below shows statistics about the top five countries for international tourism in 2012 and 2013.

The table compares the five highest ranking countries in terms of the numbers of visits and the money spent by tourists over a period of two years. It is clear that France was the world’s most popular tourist destination in the years 2012 and 2013. However, the USA earned by far the most revenue from […]

The table below shows statistics about the top five countries for international tourism in 2012 and 2013.

The table compares the number of tourists and tourist spending in the top five countries for international tourism in 2012 and 2013. Overall, France received the highest number of visitors in both years, while the USA earned the most money from tourism. Most countries saw increases in both tourist numbers and spending, except China, which […]

The table below shows statistics about the top five countries for international tourism in 2012 and 2013.

This table narrates us about the total number of tourists and their spending in the five different countries; France, USA, Spain, China and italy in the year 2012 and 2013. Overall, USA and spain have experienced a rapidly increase in the tourist and their spending.while France and Italy have increased slowly and China have experienced […]

The table below shows statistics about the top five countries for international tourism in 2012 and 2013.

The following graph illustrates statistics about international tourism for top five countries from 2012 to 2013. Overall it can be seen that the highest number of tourists visited France, while USA leading in spendings on tourists. Even though the statistics are growing, China had fall in number of tourists. Firstly, France in 2012 had 83 […]

The table below shows statistics about the top five countries for international tourism in 2012 and 2013.

The given table illustrates the top five countries in terms of the number of international tourists and their tourism expenditures in 2012 and 2013. Overall, France received the highest number of visitors in both years, while tourists in the USA spent the most money over the same period. Additionally, all countries experienced an increase in […]

See All

Other Topics:

The table below presents the food consumption per weekly in aEuropean country in 1992, 2002 and 2012.

The table illustrates the weekly consumption of five types of food, namely vegetables, meat, wheat, beans and cheese, per person in a European country in 1992, 2002 and 2012. Overall, vegetables were by far the most widely consumed food throughout the period, whereas cheese had the lowest figures. The consumption of vegetables, wheat and beans […]

The table below shows the consumption of three basic foods (wheat, maize, rice) by people in four different countries.

The table compares the consumption of three basic foods, which are wheat, maize and rice, by people, measured in calories per person per day, in four different countries. Overall, it is clear that the highest consumption of wheat was recorded at both Poland and Egypt. However, in Cambodia the consumption of rice was the dominant […]

The table shows questionnaires about the opinions of club members and general public for the new theater in one town in 2012.

The table shows opinions about new theater questioned by club members and general public in 2012. Overall, club members gave more positive ratings for facilities and quality, whereas the general public rated information more favourably. Quality recieved the lowest proportion of poor ratings, while information had the highest figure of people who choosed it to […]

The table shows the amount of total waste produced in million tonnes in six different countries in three years. Summarize the information by selecting and reporting the main features, and make comparisons where relevant.

Overall the “USA” produced highest amount of waste whereas Scotland had the lowest figures. While Poland ranked third in terms of total waste production. In 1998 “USA” produced 107 million tons of waste. The figure increased to 150 tons in 1992 and reached a peak of 200 tones in 2000.Canada, by contrast, generated only 20 […]

The table below shows information about public funding for different arts sectors in the UK in 2010 and 2020. Summarise the information by selecting and reporting the main features, and make comparisons where relevant.

The table illustrates the data related to government funding for five various sectors in the uk in 2010 and 2020. Overall, museums and Galleries are accounted for the largest funding in both years 2010 and 2020 respectively.In addition , largest proportion of soar is shown in visual arts whereas literature accounted for the negatively decline […]

The first chart below shows the results of a survey which sampled a cross-section of 100,000 people asking if they travelled abroad and why they travelled for the period 1994-98. The second chart shows their destinations over the same period. Write a report for a university lecturer describing the information shown below. You should write at least 150 words.

The charts show the number of visits abroad made by UK residents between 1994 and 1998 including their purpose if travel and the main region. Overall, holiday were by far the most common reason for traveling abroad in all five years. The total number of visits also increased continuosly, despite a small fall in 1995. […]

See All
We have detected unusual activity on your device.
Please verify your identity to continue.
Note: This verification step won't sign you in. If you have a premium account, please log in to access the service as usual.
Google/Gmail Verification
Or verify using Email/Code
We've sent a verification code to:
youremail@gmail.com (Not your email?)
Enter it below to complete the verification process.
Ensure your email address is correct, your inbox is not full, and you check your spam folder. If no email arrives, consider using an alternative email.
You will need a Premium plan to perform your action!
Note: If you already have a premium account, please log in to access our services as usual.

Plans & Pricing

Our mission is to make quality education accessible for everyone.
However, to keep our hardworking team running and this service alive, we genuinely need your support!
By opting for a premium plan, not only do you sustain us in achieving the mission, but you also unlock advanced features to enrich your learning experience.

Free

For learners who aren't pressed for time

What's included on Free
100+ Cambridge IELTS Tests
Instant IELTS Writing Task 1 & 2 Evaluation (2 times/month)
Instant IELTS Speaking Part 1, 2, & 3 Evaluation (2 times/month)
Instant IELTS Writing Task 1 & 2 Essay Generator (2 times/month)
500+ Dictation & Shadowing Exercises
100+ Pronunciation Exercises
Flashcards
Other Advanced Tools

Premium

For those serious about advancing their English proficiency, and for IELTS candidates aspiring to boost their band score by 1-2 points (especially in writing & speaking) in just 30 days or less

What's included on Premium
Save Your IELTS Test Progress & Analyze Mistakes By Question Type
Save Your Own Flashcard Sets & Use Them On Any Device
Unlock All Courses, IELTS Tests, Section & Part Practice
Unlimited AI Conversations
Unlimited AI Writing Enhancement Exercises
Unlimited IELTS Writing Task 1 & 2 Evaluation
Unlimited IELTS Speaking Part 1, 2, & 3 Evaluation
Checked Answers Will Not Be Published
Unlimited IELTS Writing Task 1 & 2 Essay Generator
Unlimited IELTS Speaking Part 1, 2, & 3 Sample Generator
Unlimited Usage Of Advanced Tools & AI Features
Priority Support within 24h (12-month plan only)

Due to the nature of our service and the provided free trials, payments are non-refundable.