Our system will evaluate the answer based on this AI-generated description.
The image contains two separate tasks; TASK 1 displays a table listing percentages of first-year students giving good ratings to various university aspects for three different years: 2000, 2005, and 2010. Teaching quality received 65% in 2000, 75% in 2005, and 69% in 2010. Print resources had 84% in 2000, 89% in 2005, and 88% in 2010. Electronic resources began at 45% in 2000, jumped to 72% in 2005, and reached 88% in 2010. The range of modules offered was rated 32% in 2000, rose to 60% in 2005, and held at 77% in 2010. Lastly, buildings/teaching facilities were consistently at 77% in both 2000 and 2005, but experienced a 6% drop to 71% in 2010. TASK 2 presents a text prompt discussing varying opinions on the Olympic games, suggesting it can either be an exciting event that unites nations or a waste of money that could be allocated elsewhere; the task requires discussing both views and providing a personal opinion.
Given the complexity of the image, the above description may not be entirely accurate.
Skyrocket your IELTS band score by 1-2 points in under a month with our premium plan!
Note: Both the topic and the answer were created by one of our users.
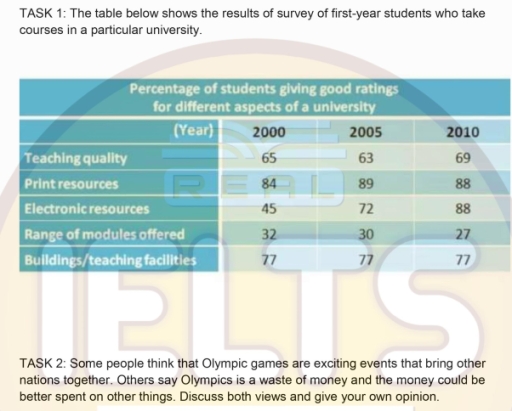
The table illustrates the percentage of students gave good ratings for different aspects of a university in three different years.
Overall, it is clear that the highest proportions of rating witnessed by the print and electronic resources, while range of models offered had the significant lowest throughout the period.
In detail, print resources accounted for the increased percentage of 84 % in 2000, teaching quality came in a second joint around at 65%, followed by teaching quality about at 65%. Moreover, in 2005, print resources ranked with 89% and electronics at 72%, respectively. Teaching quality experienced little decline with 63%, at the same year. Furthermore, print resources saved figures further, similar figures with electronics percentage of 88%, while teaching quality rose slightly to 69% in 2010.
In contrast, buildings/teaching facilities remained unchanged Sat 77%, while range of modules offered fallen at 32% to 30%, additionally to 27% over the period.
Word Count: 150
