🔥 Today Only: Save 30% on Premium — Offer Ends Soon! - Upgrade Now!
Table

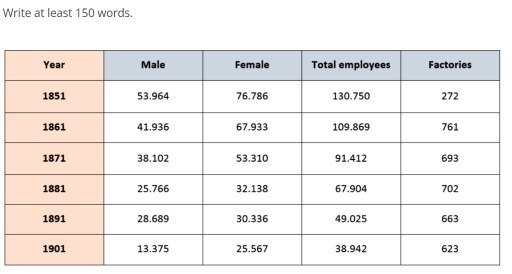
Band 5+: The table shows the number of employees and factories producing silk in England and Wales between 1851 and 1901.

Image for topic: The table shows the number of employees and factories producing silk in England and Wales between 1851 and 1901.
Our system will evaluate the answer based on this AI-generated description.
The image consists of a table with 6 columns and 5 rows. The first column indicates the years: 1851, 1861, 1871, 1881, 1891, and 1901. The second and third columns indicate the number of male and female employees, respectively. The fourth column indicates the total number of employees, and the fifth column indicates the number of factories. In 1851, there were 53,964 male employees, 76,786 female employees, 130,750 total employees, and 272 factories. In 1861, there were 41,936 male employees, 67,933 female employees, 109,869 total employees, and 761 factories. In 1871, there were 38,102 male employees, 53,310 female employees, 91,412 total employees, and 693 factories. In 1881, there were 25,766 male employees, 32,138 female employees, 67,904 total employees, and 702 factories. In 1891, there were 28,689 male employees, 30,336 female employees, 49,025 total employees, and 663 factories. In 1901, there were 13,375 male employees, 25,567 female employees, 38,942 total employees, and 623 factories. The table shows a decrease in the number of employees and a decrease in the number of factories over the 50-year period. The number of male employees decreased by 40,589, while the number of female employees decreased by 51,219. The total number of employees decreased by 91,808, and the number of factories decreased by 349. The trend indicates a steady decrease in both male and female employees, total employees, and factories across each decade.
Given the complexity of the image, the above description may not be entirely accurate.
Note: Both the topic and the answer were created by one of our users.

The table illustrates numerous workers and companies manufacturing silk in England and Wales from 1851 to 1901.

Overall, it is clearly seen that, the number of total employees was highest in all years but factories were lowest at that period and male was dominated by female workers in England and Wales.

In details, total employees reached 130.750 in 1851 whereas the figure of factories was slightly low in comparison with all year statistics. While male employers were dominated by females in two cities with about 20 ladies. Factories in 1861 and 1881 were in the range of 700. However, there was a huge difference in total employees in total employees of about 40.

Moreover, companies were slightly stable at between 600 to 700 in three years, but there is a high variation in between them, such as 38.942, 49.025 and 91.412 respectively. Lady workers were far more employed than males by 7, 2, and 12 figures in 1871, 1891, and 1901 respectively. In contrast, males head toward the unemployed while girls had a large number of jobs in factories between 1851 and 1901.

Word Count: 183

Answers On The Same Topic:

The table shows the number of employees and factories producing silk in England and Wales between 1851 and 1901.

The table illustrates number of employees and factories manufactoring silk in England and Wales between 1851 and 1901, including male and female. Overall, most number of employees was at the beginnig of this chart. All the time women were more than men. However, years by year number of total employees decreased. While number of factories […]

The table shows the number of employees and factories producing silk in England and Wales between 1851 and 1901.

The table compares the number of workers in both genders and manufactures that creating silk, in England and Wales between 1851 and 1901. Overall, the only year where the persentage employees is high occured in 1851 but with the lowest factories, then in ten years after, decrease as the second high figures for workers with […]

The table shows the number of employees and factories producing silk in England and Wales between 1851 and 1901.

The given table illustrates the number of silk factories as well as male and female employees in England and Wales from 1851 to 1901. Overall, while the year 1851 represented the lowest number of factories throughout the period, it had the largest number of employees. Additionally, female workers consistently outnumbered their male counterparts over the […]

The table shows the number of employees and factories producing silk in England and Wales between 1851 and 1901.

The table shows the number of workers of both genders and factories that manufactured silk in England and Wales from 1851 to 1901. Overall, there was a stable decreasing trend which could be observed in the figures for female workers and total employees, while the other two sectors underwent some remarkable fluctuations during a 50-year […]

The table shows the number of employees and factories producing silk in England and Wales between 1851 and 1901.

The table presents data regarding the number of employees and silk factories in England and Wales between 1851 and 1901. Overall, the total workforce experienced a consistent decline throughout this period, while the number of factories initially rose sharply before decreasing. Additionally, female employment remained consistently higher than that of male employment. Initially, there were […]

See All

Other Topics:

The table shows the two age groups participating in the marathon from 2008 to 2012. Summarize the information by selecting and reporting the main features, and make comparisons where relevant.

The table gives data on age groups attending in the marathon over the 4 year period between 2008 and 2012. Overall, it is clear that in both ages of participating showed an upward trend throughout the period. In addition, total of participants increased from 2000 in 2000 year to 2800 in 2012 year. In 2008, […]

The table shows the average annual expenditure of university students in three different countries in 2017. Summarize the information by selecting and reporting the main features, and make comparisons where relevant.

The provided diagram showcases the amount of money university students spend yearly in three countries. Overall, students in Country A spend the most total amount of spending, whereas those in Country C have the lowest, compared to other two countries. In addition, Accommodation accounts for the greatest proportion spent by students in Country A and […]

The table below gives the information about the amount of tax collected (as % of GDP) in five countries for 4 years between 1975 and 2005

The table illustrates how much percent tax collected in five countries, namely Sweden, USA, Korea, Japan and Turkey between 1975 and 2005. Overall, we can see Sweden, which ranked firstly over all years, while Turkey ranked lastly with USA in last year. In Sweden, 46% and 47% tax collected in 1975 and 1985 years and […]

The chart below shows the percentage of passenger kilometers by different modes of transport in Shanghai.

The table shows the percentage of passenger kilometers traveled by various transportation types in Shanghai in 1996 and offers a forecast for 2030. Overall, while the bus was the most popular form of transport at the earlier date, the car is expected to be the most popular in 2030. First of all, although bus had […]

The table illustrates data on the underground railway networks in six different countries, categorized by time, size, and passengers per year.

The Table presents the data of Underground railway systems of several cities. Overall, London has the oldest and longest railway track, whereas Los Angeles has the most recently established system. In contrast, Tokyo records the highest annual passenger figures, while kyoto has both shortest route and lowest passenger number. London’s underground highway opened in 1863, […]

The table details the international tourist arrivals in millions in 8 countries in 2009 and 2010 and the changes (in percentages).

The table compares eight different nations in terms of their population figures in two separate years: 2009 and 2010. Overall, almost all countries recorded increasing figures to varying degrees, save for France, whose population number remained static at high levels over a year. Notably, Germany’s population, despite being consistently modest compared to other nations, registered […]

See All
We have detected unusual activity on your device.
Please verify your identity to continue.
Note: This verification step won't sign you in. If you have a premium account, please log in to access the service as usual.
Google/Gmail Verification
Or verify using Email/Code
We've sent a verification code to:
youremail@gmail.com (Not your email?)
Enter it below to complete the verification process.
Ensure your email address is correct, your inbox is not full, and you check your spam folder. If no email arrives, consider using an alternative email.
You will need a Premium plan to perform your action!
Note: If you already have a premium account, please log in to access our services as usual.

Plans & Pricing

Our mission is to make quality education accessible for everyone.
However, to keep our hardworking team running and this service alive, we genuinely need your support!
By opting for a premium plan, not only do you sustain us in achieving the mission, but you also unlock advanced features to enrich your learning experience.

Free

For learners who aren't pressed for time

What's included on Free
100+ Cambridge IELTS Tests
Instant IELTS Writing Task 1 & 2 Evaluation (2 times/month)
Instant IELTS Speaking Part 1, 2, & 3 Evaluation (2 times/month)
Instant IELTS Writing Task 1 & 2 Essay Generator (2 times/month)
500+ Dictation & Shadowing Exercises
100+ Pronunciation Exercises
Flashcards
Other Advanced Tools

Premium

For those serious about advancing their English proficiency, and for IELTS candidates aspiring to boost their band score by 1-2 points (especially in writing & speaking) in just 30 days or less

What's included on Premium
Save Your IELTS Test Progress & Analyze Mistakes By Question Type
Save Your Own Flashcard Sets & Use Them On Any Device
Unlock All Courses, IELTS Tests, Section & Part Practice
Unlimited AI Conversations
Unlimited AI Writing Enhancement Exercises
Unlimited IELTS Writing Task 1 & 2 Evaluation
Unlimited IELTS Speaking Part 1, 2, & 3 Evaluation
Checked Answers Will Not Be Published
Unlimited IELTS Writing Task 1 & 2 Essay Generator
Unlimited IELTS Speaking Part 1, 2, & 3 Sample Generator
Unlimited Usage Of Advanced Tools & AI Features
Priority Support within 24h (12-month plan only)

Due to the nature of our service and the provided free trials, payments are non-refundable.