Our system will evaluate the answer based on this AI-generated description.
The image consists of a table with 6 columns and 5 rows. The first column indicates the years: 1851, 1861, 1871, 1881, 1891, and 1901. The second and third columns indicate the number of male and female employees, respectively. The fourth column indicates the total number of employees, and the fifth column indicates the number of factories.
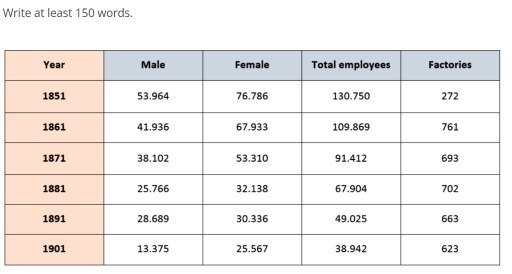
In 1851, there were 53,964 male employees, 76,786 female employees, 130,750 total employees, and 272 factories. In 1861, there were 41,936 male employees, 67,933 female employees, 109,869 total employees, and 761 factories. In 1871, there were 38,102 male employees, 53,310 female employees, 91,412 total employees, and 693 factories. In 1881, there were 25,766 male employees, 32,138 female employees, 67,904 total employees, and 702 factories. In 1891, there were 28,689 male employees, 30,336 female employees, 49,025 total employees, and 663 factories. In 1901, there were 13,375 male employees, 25,567 female employees, 38,942 total employees, and 623 factories.
The table shows a decrease in the number of employees and a decrease in the number of factories over the 50-year period. The number of male employees decreased by 40,589, while the number of female employees decreased by 51,219. The total number of employees decreased by 91,808, and the number of factories decreased by 349. The trend indicates a steady decrease in both male and female employees, total employees, and factories across each decade.
Given the complexity of the image, the above description may not be entirely accurate.
Skyrocket your IELTS band score by 1-2 points in under a month with our premium plan!
Note: Both the topic and the answer were created by one of our users.
The table compares the number of workers in both genders and manufactures that creating silk, in England and Wales between 1851 and 1901.
Overall, the only year where the persentage employees is high occured in 1851 but with the lowest factories, then in ten years after, decrease as the second high figures for workers with the most factories. Meanwhile in 1901 has the smallest workers but known as the fourth largest factories.
At the beginning centuries the total figures was 130.000 with 272 factories as the lowest, then ten years next declined to 109.869 individuals, but having 761 factories which positioned at the top. This contrast with the time that happened in the last year, where the figures dropped to be 38.942 workers, with total 623 factories which is placed in the fourth as a largest.
The remaining years that start in 1871 to 1891, only has figure under 100.000 average workers, and experienced a flunctuated amount of factories from 693 to 663.
Word Count: 163