Our system will evaluate the answer based on this AI-generated description.
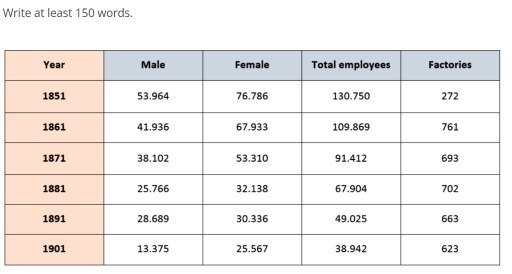
The image consists of a table with 6 columns and 5 rows. The first column indicates the years: 1851, 1861, 1871, 1881, 1891, and 1901. The second and third columns indicate the number of male and female employees, respectively. The fourth column indicates the total number of employees, and the fifth column indicates the number of factories.
In 1851, there were 53,964 male employees, 76,786 female employees, 130,750 total employees, and 272 factories. In 1861, there were 41,936 male employees, 67,933 female employees, 109,869 total employees, and 761 factories. In 1871, there were 38,102 male employees, 53,310 female employees, 91,412 total employees, and 693 factories. In 1881, there were 25,766 male employees, 32,138 female employees, 67,904 total employees, and 702 factories. In 1891, there were 28,689 male employees, 30,336 female employees, 49,025 total employees, and 663 factories. In 1901, there were 13,375 male employees, 25,567 female employees, 38,942 total employees, and 623 factories.
The table shows a decrease in the number of employees and a decrease in the number of factories over the 50-year period. The number of male employees decreased by 40,589, while the number of female employees decreased by 51,219. The total number of employees decreased by 91,808, and the number of factories decreased by 349. The trend indicates a steady decrease in both male and female employees, total employees, and factories across each decade.
Given the complexity of the image, the above description may not be entirely accurate.
Skyrocket your IELTS band score by 1-2 points in under a month with our premium plan!
Note: Both the topic and the answer were created by one of our users.
The given illustrate the quantity of workers and companies that producing silk in England and Wales from 1851 to 1901.
Overall, we can see that the number of people doing job in silk producing factories is decreasing over the period. In between 1881-1881 larger number of factories were opened.
Looking at details, in 1851 there were 53.964 male and 76.786 females who were working in 272 factories. Similarly, figure of male and female decline in 1861. This trend continued to dropped 13.375 and 25.567 for men and women respectively in 1901.
whereas, the silk manufacturing companies were least in 1851. This number reached to the peak 761 in 1861. Again factories number decreased to 692 in 1871 before saw 702 in 1881. There were 663 and 623 factories in 1891 and 1901 respectively.
Word Count: 133
