Our system will evaluate the answer based on this AI-generated description.
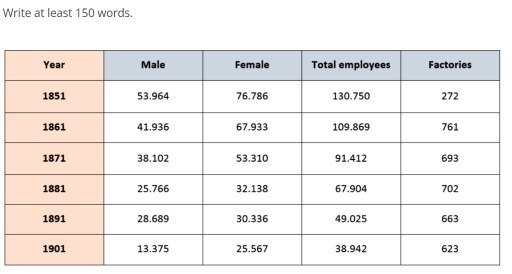
The image consists of a table with 6 columns and 5 rows. The first column indicates the years: 1851, 1861, 1871, 1881, 1891, and 1901. The second and third columns indicate the number of male and female employees, respectively. The fourth column indicates the total number of employees, and the fifth column indicates the number of factories.
In 1851, there were 53,964 male employees, 76,786 female employees, 130,750 total employees, and 272 factories. In 1861, there were 41,936 male employees, 67,933 female employees, 109,869 total employees, and 761 factories. In 1871, there were 38,102 male employees, 53,310 female employees, 91,412 total employees, and 693 factories. In 1881, there were 25,766 male employees, 32,138 female employees, 67,904 total employees, and 702 factories. In 1891, there were 28,689 male employees, 30,336 female employees, 49,025 total employees, and 663 factories. In 1901, there were 13,375 male employees, 25,567 female employees, 38,942 total employees, and 623 factories.
The table shows a decrease in the number of employees and a decrease in the number of factories over the 50-year period. The number of male employees decreased by 40,589, while the number of female employees decreased by 51,219. The total number of employees decreased by 91,808, and the number of factories decreased by 349. The trend indicates a steady decrease in both male and female employees, total employees, and factories across each decade.
Given the complexity of the image, the above description may not be entirely accurate.
Skyrocket your IELTS band score by 1-2 points in under a month with our premium plan!
Note: Both the topic and the answer were created by one of our users.
The given table represents the total number of employees (male and female) working in silk factories and the number of factories producing silk in England and Wales from 1851 to 1901.
In general, the number of female workers in factories was considerably higher than the number of males; however, both exhibit a decreasing trend in the total number of workers. Similarly, the number of factories fluctuated over the given period of time.
In 1851, there were a total of 130,750 workers, of which the maximum were female—76,786—while the remaining were male—53,964. The number of employees working in silk factories constantly declined over the next four decades, reaching 67,904, of which 32,138 were women and the rest were men—25,766. However, in 1891, the number of male employees rose by 2,923, reaching 28,689, which is similar to the number of female workers—30,336. Furthermore, in the next decade, the number of male workers sharply declined to 13,375, with the total number of employees falling to just 38,942.
On the other hand, there were 272 factories producing silk in 1851, which dramatically increased to 761 in the next ten years. However, the number of factories kept fluctuating over the next two decades before declining to 623 in 1901.
Word Count: 204
