🔥 Today Only: Save 30% on Premium — Offer Ends Soon! - Upgrade Now!
Table

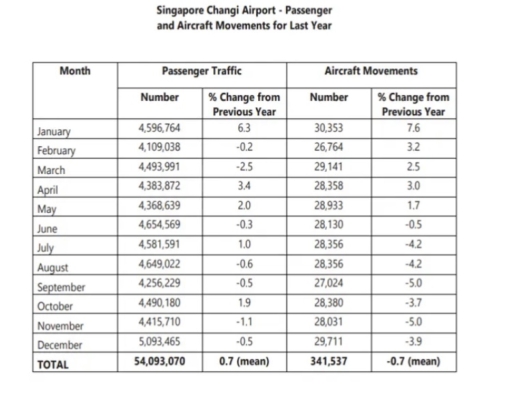
Band 5+: The table shows the passenger and aircraft movements for last year at Singapore Changi Airport. Summarise the information by selecting and reporting the main features, and make comparisons where relevant.

Image for topic: The table shows the passenger and aircraft movements for last year at Singapore Changi Airport. Summarise the information by selecting and reporting the main features, and make comparisons where relevant.
Our system will evaluate the answer based on this AI-generated description.
The image shows data for Singapore Changi Airport's passenger and aircraft movements over the last year by month: January passenger traffic 4,596,764 (6.3%), aircraft movements 30,353 (7.6%); February passenger traffic 4,109,038 (-0.2%), aircraft movements 26,764 (3.2%); March passenger traffic 4,493,991 (-2.5%), aircraft movements 29,141 (2.5%); April passenger traffic 4,383,872 (-3.7%), aircraft movements 28,419 (-3.7%); May passenger traffic 4,368,639 (2.0%), aircraft movements 28,933 (1.7%); June passenger traffic 4,654,569 (5.0%), aircraft movements 28,356 (-4.2%); July passenger traffic 4,581,591 (-0.8%), aircraft movements 28,542 (-0.6%); August passenger traffic 4,649,022 (-0.6%), aircraft movements 28,356 (-4.2%); September passenger traffic 4,256,229 (-3.5%), aircraft movements 27,836 (-8.7%); October passenger traffic 4,490,180 (1.9%), aircraft movements 28,380 (-5.0%); November passenger traffic 4,415,710 (0.3%), aircraft movements 29,651 (-3.9%); December passenger traffic 5,093,465 (0.5%), aircraft movements 29,711 (-5.9%); total passenger traffic 54,093,070 (0.7% mean), total aircraft movements 341,537 (-0.7% mean).
Given the complexity of the image, the above description may not be entirely accurate.
Note: Both the topic and the answer were created by one of our users.

The given table illustrates how many passengers and air crafts moved in last year at Changi airport Singapore.

Overall, it is clear that the highest number of Changi Airport Passengers moved in December. By contrast, total air crafts number was lowest in the same month.

According to the statistics, in Janurary, around 4.5 million passengers moved in that air port, and changing ratio was 6.3 percent than previous year. On the other hand, in the same time, total 30,353 air crafts were available for these passengers, and changing air bus ratio was 7.6 %.

Moreover, the number of air-bus passengers increase from 4,109,038 in February to 5,093,465 in December, a rise of over a 1 luck passengers over the period of 11 months. while the changing ratio witnessed a significant fluctuation during these period. On the contrary, after the fall, the quantaty of air craft again increase till last month, which figures were 26,764 and 29,711 respectively, and the aeroplanes experienced minor quantity this transport than the account of increasing passengers. Furthermore, the changing ratio of air bus decreased to -39 in December.

In more detail, total number of Passengers were below 5.5 millions, whereas the sum airplanes number was 3,41,537.

Word Count: 201

Answers On The Same Topic:

The table shows the passenger and aircraft movements for last year at Singapore Changi Airport. Summarise the information by selecting and reporting the main features, and make comparisons where relevant.

The table shows the number of passengers and aircraft movements at Singapore Changi Airport over a one-year period. Overall, it can be seen that passenger traffic increased on average, while aircraft movements experienced a small overall decline. In teams of passenger traffic, the number of passenger fluctuated over the year. January recorded about 4.5 million […]

The table shows the passenger and aircraft movements for last year at Singapore Changi Airport. Summarise the information by selecting and reporting the main features, and make comparisons where relevant.

The Plans represent the layout of a university’s sports centre now, and now it will look afmer development. It is clear that the university sports centre have Witnessed massive infrastructural development in the Present, while the map will mordenized compare to at present, in the mean time, Dance studio, cafe, studio, sports shap and leisure […]

The table shows the passenger and aircraft movements for last year at Singapore Changi Airport. Summarise the information by selecting and reporting the main features, and make comparisons where relevant.

The figure illustrates the passengers trafic and flights mouvments by number, monthes, and percentages of changes from the previous year in Changi Airport. Overall, it can be seen that the passengers slightly fluctuated over the year and with a slight increase compared the last year, it reached a high numbers in winter’s monthes( November, and […]

The table shows the passenger and aircraft movements for last year at Singapore Changi Airport. Summarise the information by selecting and reporting the main features, and make comparisons where relevant.

This chart gives a lot of information. Not only number of aircraft movements but also about number of passengers.According to it in the beginning of year or if I say mor detailed January the percentage of passengers grew really high. Higher than it was last year.Also it’s the highest percentage among all the months.But in […]

The table shows the passenger and aircraft movements for last year at Singapore Changi Airport. Summarise the information by selecting and reporting the main features, and make comparisons where relevant.

The table provides information about monthly passenger traffic and aircraft movements at Singapore Changi Airport over the course of last year, together with the percentage change from the previous year. Overall, while the total number of passengers slightly increased, the reverse was true for aircraft movements. Passenger traffic peaked in December, whereas aircraft movements were […]

See All

Other Topics:

The table below shows the results of survey of first-year students who take courses in a particular university.

The table shows how the proportion of students giving high ratings for different aspects of a university changed in 2000, 2005 and 2010. Overall, ranking rates for teaching quality, print resources, and electronic resources saw increases of varying degrees, with the last one experiencing the biggest growth. By contrast, evaluation of building and teaching materials […]

The table below gives information on household spending on different items in five different countries in 2004. Summarise the information by selecting and reporting the main features, and make comparisons where relevant.

The table illustrates the proportion of household expenditure on numerous items in five various nations during 2004. Overall, Turkey has the highest proportion of spending in all factors while, the second lead is taken by Ireland. The rest of the countries only differ by some amount in all sectors. In 2004, Turkey citizens spend most […]

The table below provides a breakdown of the amount of different cereals produced by several countries in Europe in 2000. Summarise the information by selecting and reporting the main features, and make comparisons where relevant.

The table illustrates the production of three different cereals by several countries in Europe in 2000. Overall, the figures for common wheat and spelt production were the highest, particularly in France. By contrast, the lowest the numbers were rye and maslin, with the lowest concentration in Bulgaria. It is clear that the amount of the […]

The table below provides a breakdown of the amount of different cereals produced by several countries in Europe in 2000. Summarise the information by selecting and reporting the main features, and make comparisons where relevant.

The table illustrates the production of three different cereals by several countries in Europe in 2000. Overall, the figure for common wheat and spelt production was the highest, particularly in France. By contrast, the lowest the numbers were rye and maslin, with the lowest concentration in Bulgaria. It is clear that the amount of the […]

The table below shows the percentage of first-year students who gave 'very good' rating to the resources provided by their college, for three courses. Summarize the information by selecting and reporting the main features, and make comparisons where relevant.

The table above shows proportions about the students who gave rating ‘very good’ for the quality of resources that provide for them in their colleges in three different subjects. Overall, students gave the highest proportion of ‘very good’ openion about the resources that they have received in their colleges for commerce speciality, and their grade […]

The table below gives information about students studying in six departments in an Australian university in 2011. Summarize the information by selecting and reporting the main features, and make comparisons where relevant

The table displays data regarding the students of six different departments in an Australian university in 2011. Overall, it is apparent from the table that the largest number of female students studied in English language department while the least percentage of them were from Chemistry department. In 2011 English department was the dominant one among […]

See All
We have detected unusual activity on your device.
Please verify your identity to continue.
Note: This verification step won't sign you in. If you have a premium account, please log in to access the service as usual.
Google/Gmail Verification
Or verify using Email/Code
We've sent a verification code to:
youremail@gmail.com (Not your email?)
Enter it below to complete the verification process.
Ensure your email address is correct, your inbox is not full, and you check your spam folder. If no email arrives, consider using an alternative email.
You will need a Premium plan to perform your action!
Note: If you already have a premium account, please log in to access our services as usual.

Plans & Pricing

Our mission is to make quality education accessible for everyone.
However, to keep our hardworking team running and this service alive, we genuinely need your support!
By opting for a premium plan, not only do you sustain us in achieving the mission, but you also unlock advanced features to enrich your learning experience.

Free

For learners who aren't pressed for time

What's included on Free
100+ Cambridge IELTS Tests
Instant IELTS Writing Task 1 & 2 Evaluation (2 times/month)
Instant IELTS Speaking Part 1, 2, & 3 Evaluation (5 times/month)
Instant IELTS Writing Task 1 & 2 Essay Generator (2 times/month)
500+ Dictation & Shadowing Exercises
100+ Pronunciation Exercises
Flashcards
Other Advanced Tools

Premium

For those serious about advancing their English proficiency, and for IELTS candidates aspiring to boost their band score by 1-2 points (especially in writing & speaking) in just 30 days or less

What's included on Premium
Save Your IELTS Test Progress
Unlock All Courses & IELTS Tests
Unlimited AI Conversations
Unlimited AI Writing Enhancement Exercises
Unlimited IELTS Writing Task 1 & 2 Evaluation
Unlimited IELTS Speaking Part 1, 2, & 3 Evaluation
Checked Answers Will Not Be Published
Unlimited IELTS Writing Task 1 & 2 Essay Generator
Unlimited IELTS Speaking Part 1, 2, & 3 Sample Generator
Unlimited Usage Of Advanced Tools
Priority Support within 24h (12-month plan only)

Due to the nature of our service and the provided free trials, payments are non-refundable.
Nếu bạn là người Việt Nam và không có hoặc không muốn trả bằng credit/debit cards, bạn có thể thanh toán bằng phương thức chuyển khoản:


Chọn gói:
419,000₫ 277,000 ₫ cho gói 1 tháng (chỉ 9,233₫/ngày)
1,239,000₫ 597,000 ₫ cho gói 3 tháng (chỉ 6,633₫/ngày)
2,469,000₫ 1,027,000 ₫ cho gói 6 tháng (chỉ 5,706₫/ngày)
4,929,000₫ 1,417,000 ₫ cho gói 12 tháng (chỉ 3,936₫/ngày)


Sau khi chuyển khoản, vui lòng đợi trình duyệt tự động điều hướng bạn trở lại Engnovate và bạn sẽ ngay lập tức nhận được mã kích hoạt tài khoản premium.
Nếu có lỗi xảy ra, bạn có thể liên hệ với team thông qua một trong các phương thức: email đến helloengnovate@gmail.com hoặc nhắn tin qua facebook.com/engnovate.
Vì toàn bộ công cụ trên website đều có thể sử dụng thử miễn phí, Engnovate không hỗ trợ hoàn tiền.