Our system will evaluate the answer based on this AI-generated description.
The image shows two tables analyzing last year's U.S. workforce for workers in the U.S. of foreign and U.S. birth, with data in thousands. First table (foreign birth): Total in workforce: 15-24: 2,180, 1,475 employed, 706 unemployed, 32.38% unemployment rate; 25-34: 3,032, 2,646 employed, 386 unemployed, 12.73% unemployment rate; 35-44: 3,433, 3,208 employed, 224 unemployed, 6.52% unemployment rate; 45-54: 2,678, 2,589 employed, 89 unemployed, 3.32% unemployment rate; 55+: 2,036, 1,930 employed, 106 unemployed, 5.20% unemployment rate. Second table (U.S. birth): Total in workforce: 15-24: 25,401, 17,645 employed, 7,755 unemployed, 30.52% unemployment rate; 25-34: 28,383, 25,227 employed, 3,156 unemployed, 11.12% unemployment rate; 35-44: 34,057, 32,215 employed, 1,842 unemployed, 5.41% unemployment rate; 45-54: 33,155, 31,170 employed, 1,985 unemployed, 5.99% unemployment rate; 55+: 26,558, 25,417 employed, 1,141 unemployed, 4.30% unemployment rate.
Given the complexity of the image, the above description may not be entirely accurate.
Skyrocket your IELTS band score by 1-2 points in under a month with our premium plan!
Note: Both the topic and the answer were created by one of our users.
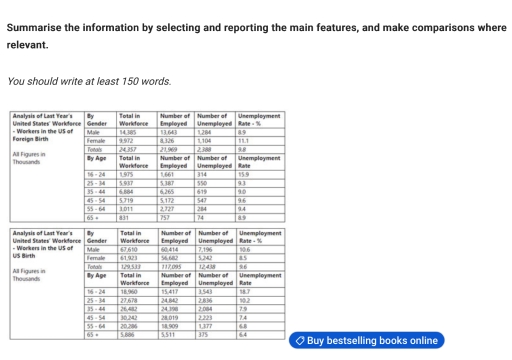
The tables illustrate the rate of foreign employees and the birth of US in the United States last year.
Overall, there was shown every details by gender and by age also, the total amount of workers in both tables. It is also provided that the number of employed and unemployed people by showing with the number and percentage.
As can be seen in the given two tables , the proportion of unemployed and employed in every sector presents that males is much higher than females. However, unemployment’s rate of foreign employees was lower than the citizens of USA, but it do not have dramatic effect in comparison foreigners to 9.8 and USA citizens 9.6.
Getting back to the details, it is obviously displayed that foreigners who are in the middle ages around 35-44 years old worked in the United States Kingdom compared with other age, while the citizens of the United States Kingdom who were employed were over the age of 45-54.
Word Count: 162