🔥 Today Only: Save 30% on Premium — Offer Ends Soon! - Upgrade Now!
Bar Chart

Band 4+: This bar chart illustrates the number of students studying different subjects at university level over a five-year period.

Image for topic: This bar chart illustrates the number of students studying different subjects at university level over a five-year period.
Our system will evaluate the answer based on this AI-generated description.
The image displays a bar chart of student numbers by subject across five academic years. 96/97: Medicine and Dentistry 135,000; Biological Sciences 82,000; Physical Sciences 80,000; Computer Sciences 82,000; Engineering and Technology 40,000. 97/98: Medicine and Dentistry 133,000; Biological Sciences 84,000; Physical Sciences 82,000; Computer Sciences 85,000; Engineering and Technology 41,000. 98/99: Medicine and Dentistry 132,000; Biological Sciences 86,000; Physical Sciences 84,000; Computer Sciences 87,000; Engineering and Technology 43,000. 99/00: Medicine and Dentistry 130,000; Biological Sciences 87,000; Physical Sciences 85,000; Computer Sciences 88,000; Engineering and Technology 44,000. 00/01: Medicine and Dentistry 129,000; Biological Sciences 88,000; Physical Sciences 86,000; Computer Sciences 89,000; Engineering and Technology 45,000.
Given the complexity of the image, the above description may not be entirely accurate.
Note: Both the topic and the answer were created by one of our users.

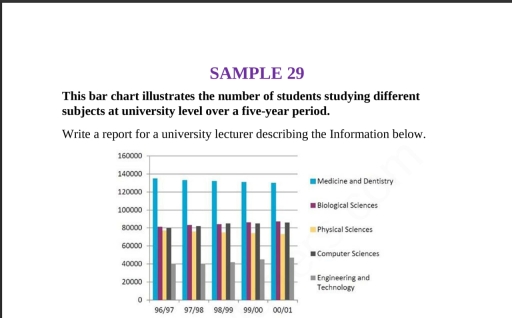
This bar graph represents the number of students studying different subjects at university level over a five year period .As we can see the subject are Medicine and dentistry,Biological science,physical science,computer science,Engineering and technology.

It is clear that Most number of students have studied medicine and dentistry in the five year period .and the total of students is 135000.The miniority of students like to study in engineering and technology . during in 1996-1999 years the equal number of students prefer stuying engineering and technology.in 1996-1997 ,equal number of students who are interested in studying compiter scienece and bio logical science.During the last two years period the least number of students have been studying physical science As i think reason for that physical science is hardest subject.

In conclusion of the bar chart we can see Most number of students want to be doctors or denstists

Word Count: 145

Answers On The Same Topic:

This bar chart illustrates the number of students studying different subjects at university level over a five-year period.

The bar chart below depicts the proportion of students studying different subject at university level between1996 and 2001. Overall, medicine and dentistry recorded the largest proportion of students; on the other hand, engineering and technology witnessed the lowest participation. Sectors belonging to subjects did not undergo considerable changes. It is evident that the number of […]

This bar chart illustrates the number of students studying different subjects at university level over a five-year period.

The chart below demonstrates the number of students attended different subjects in a university from 1996 to 2001. Overall, medicine and dentistry were the most populated subject among students, while engineering and technology were experienced the lowest proportion of students. In 96/97, 40000 students were studying engineering and technology. The rate for computer, physical, and […]

See All

Other Topics:

The charts show information about the percentage of men and women aged 60-64 who were employed in four countries in 1970 and 2000.

The two bar charts compare data regarding the percentage of employment in males and females aged 60-64 of the year 1970AD and 2000AD in four different countries: Belgium, USA, Japan, and Indonesia. In the year 1970AD, all countries have higher percentage of men in their early-sixties working than women. The country with lowest difference between […]

The bar chart compares the amount of money (in millions of euros) that people in four different age groups from Paris, France, spent on going to the cinema, restaurants and music concerts in 2019.

The bar chart illustrates the amount of money in million of euros spent in four different age groups people who they spend on going to the across three different places in the year 2019. In general, different trends were observed all the given categories. While the restaurants recorded the highest figure of spent money almost […]

The chart shows the number of households in the us by thier annual income in 2007,20011and 2015.

The bar chart illustrates the number of residence owners( in millions) in the US by their year-over-year income in 3 different years, in 2007, 2011 and 2015. Overall, the most significant changes over the period were seen in households earning less than $50,000 and those earning $100,000 or more, with noticable increase in the latter […]

The graph below gives information about the common activities children of different ages in the United States do as part of their bedtime routines.

The bar chart illustrates data about common activities among children aged 1-3,4-5 and 6-8 in the United States. Overall,reading and brushing teeth are the most popular activities across all age groups,while eating and wathing TV are less common.In general,younger children tend to follow bedtime routines more consistently that older ones. In detal,reading is the most […]

the charts give information about two genres of TV programes watched by men and women and four different age groups in Australia.

The charts illustrate the proportion of men and women, as well as four distinct age groups, who watch two types of television programmes in Australia. Overall, it is evident that women tend to watch these programmes more than men, and viewership generally increases with age. In particular, older age groups show a significantly higher preference […]

The chart below shows the different levels of post-school qualifications in Austria and the proportion of men and women who held them in 1999.

The bar chart illustrates the different levels of post-school qualifications in Australia and the proportion of males and females who held them in 1999. Overall, it is clear that men dominated in most higher-level qualifications, while women were more represented in lower-level diplomas. In terms of skilled vocational diplomas, a significantly higher percentage of men […]

See All
We have detected unusual activity on your device.
Please verify your identity to continue.
Note: This verification step won't sign you in. If you have a premium account, please log in to access the service as usual.
Google/Gmail Verification
Or verify using Email/Code
We've sent a verification code to:
youremail@gmail.com (Not your email?)
Enter it below to complete the verification process.
Ensure your email address is correct, your inbox is not full, and you check your spam folder. If no email arrives, consider using an alternative email.
You will need a Premium plan to perform your action!
Note: If you already have a premium account, please log in to access our services as usual.

Plans & Pricing

Our mission is to make quality education accessible for everyone.
However, to keep our hardworking team running and this service alive, we genuinely need your support!
By opting for a premium plan, not only do you sustain us in achieving the mission, but you also unlock advanced features to enrich your learning experience.

Free

For learners who aren't pressed for time

What's included on Free
100+ Cambridge IELTS Tests
Instant IELTS Writing Task 1 & 2 Evaluation (2 times/month)
Instant IELTS Speaking Part 1, 2, & 3 Evaluation (5 times/month)
Instant IELTS Writing Task 1 & 2 Essay Generator (2 times/month)
500+ Dictation & Shadowing Exercises
100+ Pronunciation Exercises
Flashcards
Other Advanced Tools

Premium

For those serious about advancing their English proficiency, and for IELTS candidates aspiring to boost their band score by 1-2 points (especially in writing & speaking) in just 30 days or less

What's included on Premium
Save Your IELTS Test Progress
Unlock All Courses & IELTS Tests
Unlimited AI Conversations
Unlimited AI Writing Enhancement Exercises
Unlimited IELTS Writing Task 1 & 2 Evaluation
Unlimited IELTS Speaking Part 1, 2, & 3 Evaluation
Checked Answers Will Not Be Published
Unlimited IELTS Writing Task 1 & 2 Essay Generator
Unlimited IELTS Speaking Part 1, 2, & 3 Sample Generator
Unlimited Usage Of Advanced Tools
Priority Support within 24h (12-month plan only)

Due to the nature of our service and the provided free trials, payments are non-refundable.
Nếu bạn là người Việt Nam và không có hoặc không muốn trả bằng credit/debit cards, bạn có thể thanh toán bằng phương thức chuyển khoản:


Chọn gói:
419,000₫ 277,000 ₫ cho gói 1 tháng (chỉ 9,233₫/ngày)
1,239,000₫ 597,000 ₫ cho gói 3 tháng (chỉ 6,633₫/ngày)
2,469,000₫ 1,027,000 ₫ cho gói 6 tháng (chỉ 5,706₫/ngày)
4,929,000₫ 1,417,000 ₫ cho gói 12 tháng (chỉ 3,936₫/ngày)


Sau khi chuyển khoản, vui lòng đợi trình duyệt tự động điều hướng bạn trở lại Engnovate và bạn sẽ ngay lập tức nhận được mã kích hoạt tài khoản premium.
Nếu có lỗi xảy ra, bạn có thể liên hệ với team thông qua một trong các phương thức: email đến helloengnovate@gmail.com hoặc nhắn tin qua facebook.com/engnovate.
Vì toàn bộ công cụ trên website đều có thể sử dụng thử miễn phí, Engnovate không hỗ trợ hoàn tiền.