🔥 Today Only: Save 30% on Premium — Offer Ends Soon! - Upgrade Now!
Bar Chart

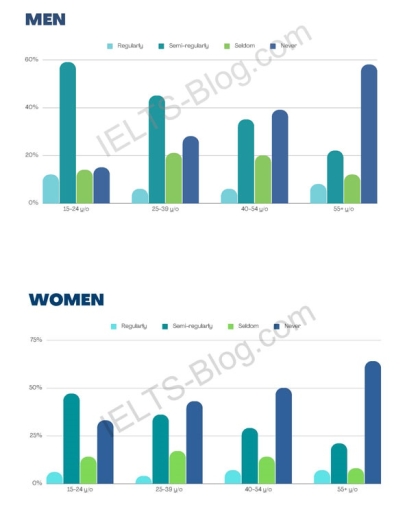
Band 5+: two bar graphs showing how often people exercised europe 2016

Image for topic: two bar graphs showing how often people exercised europe 2016
Our system will evaluate the answer based on this AI-generated description.
The image shows two bar charts depicting percentages of regular, semi-regular, and seldom activity among men and women in four age groups: 15-24, 25-39, 40-54, and 55+. In the Men's chart, Regular activity is highest in the 55+ group at approx 70%, followed by 25-39 at over 50%, then 40-54 at approx 50%, and lowest in 15-24 at less than 20%. Semi-regular activity is relatively uniform across age groups, ranging from approx 20% to 30%. Seldom activity is highest in the 15-24 group at over 60%, decreases with age, with the 55+ group at less than 10%. In the Women's chart, Regular activity is highest in the 55+ group at over 50%, then 40-54 at over 40%, 25-39 at approx 40%, and lowest in 15-24 at less than 20%. Semi-regular activity trends similarly to men, with a range from 20% to slightly over 30%. Seldom activity is highest in the 15-24 group at over 50%, decreases with age, with 55+ at approx 10%.
Given the complexity of the image, the above description may not be entirely accurate.
Note: Both the topic and the answer were created by one of our users.

The bar charts illustrate the frequency of European men and women engaged in sports activities, which were divided into four age groups (15 to 24 years old, 25 to 39 years old, 40 to 54 years old, and 55 years old).

The graphs revealed that both genders have a similar trend in terms of engaging in any sport activities. By age, the contribution of people who actively exercised continued to decrease steadily as they got older, peaking at 59% for the men’s groups, with age above 55 years old, while women reached slightly less than men, at 65%.

Those data also revealed another fact that the number of men and women aged above 55 years old, who semi-regularly exercised, experienced a steady fall to 21% and 18%, respectively. Even though their contribution to the semi-regular sports cohort had a small gap, men’s stood at 60% initially, which was significantly higher than women, who only contributed to 45% when they were reaching between 15 to 24 years old.

Looking to the contribution of people who regularly and seldom exercised, remained stable, and contributed less than 22% each, throughout the periods.

Word Count: 189

Answers On The Same Topic:

two bar graphs showing how often people exercised europe 2016

The graphs represent the data about the frequency of training between different age groups of people (15-20, 25-39, 40-54 and 55+ years old) and gender. Overall, young males exercised semi-regularly as the frequency dropped between elderly men. As for the women, they exercise less compared to males in their early years and never train as […]

two bar graphs showing how often people exercised europe 2016

Overall, two bar charts show the average amount of exercise among men and women divided by their ages. Initially, among men, the majority between the ages of 15 and 24 exercise almost regularly. Likewise, older people between 25 and 39. However, as men get older, the rate of exercising is followed by a huge fall. […]

two bar graphs showing how often people exercised europe 2016

The bar charts illustrate how often men and women belonging to different age groups exercise in Europe in the year 2016. Considering the overall age groups in the survey, on average men tend to exercise slightly more than women. In contrast, the former also have a larger percentage who rarely exercise than the latter. People […]

two bar graphs showing how often people exercised europe 2016

The bar chart shows how often men and women of different age groups exercised in Europe in 2016. In the two diagrams, there are 4 age groups, namely 15–24, 25–39, 40–54, and 55+. In the male diagram, the highest semi-regular activity is at the age of 15–24 with a percentage of less than 60%, followed […]

See All

Other Topics:

The chart below shows the main reasons why agricultural land becomes less productive in three regions of the world. Summarise the information by selecting and reporting the main features, and make comparisons where relevant.

This essay will explain a chart that represents the main causes why agricultural land becomes less productive in three regions which are North America, Europe, and Oceania. Overall, Over-grazing is the largest cause of worldwide land degradation and is in the region Oceania. However, Europe is affected by every factor presented. And North-America land is […]

The chart below shows the percentage of children in a European country who took part in four kinds of activities in 2009

The provided chart displays the proportion of children in one particular country in Europe who participated in four different types of activities in 2009. Overall, children who were from 5 to 8 years old mostly prefered to watch TV; however, less of them found playing video games engaging. Simultaneously, kids from 9 to 11 also […]

The chart below shows the main reasons why agricultural land becomes less productive in three regions of the world. Summarise the information by selecting and reporting the main features, and make comparisons where relevant.

The given bar graph illustrates the causes of agricultural land degradation in three continents in percentage. Overall, the main factor for land deterioration in North America, Europe, and Oceania, is over-cultivation, deforestation, and over- grazing, respectively. To begin with, the highest amount of soil depletion in Europe is due to cutting of trees and over-cultivation […]

The chart below shows the value of some of Australia's trading links in 2012,2013 and 2014. Summarise the information by selecting and reporting the main features,and making comparisons where relevant.

The bar chart illustrates the value of trading links of Australia in three years: 2012, 2013 and 2014. Overall, there are five Asian partners of Australia in route of trade /China, Japan, Korea, Thailand and Vietnam/, by cost of connections in million US dollars. It is clear that, China has been working in way of […]

The bar chart shows the percentage of adult male smokers in seven countries along with the world average in 2000 and 2015. Summarise the information by selecting and reporting the main features and make comparisons where relevant. Write at least 150 words.

The presented bar chart illustrates the percentage of adult male smokers in seven countries along with the world average, namely World, Armenia, Egypt, Lebanon, Bangladesh, Cuba, Mexico, and Australia in years 2000 and 2015. Overall, it is evident that Armenia recorded the largest, whereas Australia had the smallest, in 2000. However, in 2015, Armenia and […]

The bar graph below represents the data about the clubs joined by the people of two different age groups at a leisure center. Summarise the information by selecting and reporting the main features, and make comparisons where relevant.

The bar graph illustrates the number of members who joined six clubs at a leisure center preferred by age groups 25 to 35 and 55 to 65. Overall, there was a striking difference in figures of both the age groups for gardening, arts and crafts and cycling, while photography, fitness and music/dance clubs had negligible […]

See All
We have detected unusual activity on your device.
Please verify your identity to continue.
Note: This verification step won't sign you in. If you have a premium account, please log in to access the service as usual.
Google/Gmail Verification
Or verify using Email/Code
We've sent a verification code to:
youremail@gmail.com (Not your email?)
Enter it below to complete the verification process.
Ensure your email address is correct, your inbox is not full, and you check your spam folder. If no email arrives, consider using an alternative email.
You will need a Premium plan to perform your action!
Note: If you already have a premium account, please log in to access our services as usual.

Plans & Pricing

Our mission is to make quality education accessible for everyone.
However, to keep our hardworking team running and this service alive, we genuinely need your support!
By opting for a premium plan, not only do you sustain us in achieving the mission, but you also unlock advanced features to enrich your learning experience.

Free

For learners who aren't pressed for time

What's included on Free
100+ Cambridge IELTS Tests
Instant IELTS Writing Task 1 & 2 Evaluation (2 times/month)
Instant IELTS Speaking Part 1, 2, & 3 Evaluation (2 times/month)
Instant IELTS Writing Task 1 & 2 Essay Generator (2 times/month)
500+ Dictation & Shadowing Exercises
100+ Pronunciation Exercises
Flashcards
Other Advanced Tools

Premium

For those serious about advancing their English proficiency, and for IELTS candidates aspiring to boost their band score by 1-2 points (especially in writing & speaking) in just 30 days or less

What's included on Premium
Save Your IELTS Test Progress & Analyze Mistakes By Question Type
Save Your Own Flashcard Sets & Use Them On Any Device
Unlock All Courses, IELTS Tests, Section & Part Practice
Unlimited AI Conversations
Unlimited AI Writing Enhancement Exercises
Unlimited IELTS Writing Task 1 & 2 Evaluation
Unlimited IELTS Speaking Part 1, 2, & 3 Evaluation
Checked Answers Will Not Be Published
Unlimited IELTS Writing Task 1 & 2 Essay Generator
Unlimited IELTS Speaking Part 1, 2, & 3 Sample Generator
Unlimited Usage Of Advanced Tools & AI Features
Priority Support within 24h (12-month plan only)

Due to the nature of our service and the provided free trials, payments are non-refundable.
Buy activation codes in bulk and give one to each learner. A code does not expire until it is used, and each subscription only starts counting once its code is entered, so you can buy now and hand them out later.

10+ codes: 10% off 25+ codes: 15% off 50+ codes: 20% off
The codes are emailed to your payment address as soon as the payment goes through, and are also shown on the confirmation page. A tax invoice is issued automatically at checkout — select Purchasing as a business there to put your organization's name and tax ID on it.
Nếu bạn là người Việt Nam và không có hoặc không muốn trả bằng credit/debit cards, bạn có thể thanh toán bằng phương thức chuyển khoản:


Chọn gói:
419,000₫ 277,000 ₫ cho gói 1 tháng (chỉ 9,233₫/ngày)
1,239,000₫ 597,000 ₫ cho gói 3 tháng (chỉ 6,633₫/ngày)
2,469,000₫ 1,027,000 ₫ cho gói 6 tháng (chỉ 5,706₫/ngày)
4,929,000₫ 1,417,000 ₫ cho gói 12 tháng (chỉ 3,936₫/ngày)


Sau khi chuyển khoản, vui lòng đợi trình duyệt tự động điều hướng bạn trở lại Engnovate và bạn sẽ ngay lập tức nhận được mã kích hoạt tài khoản premium.
Nếu có lỗi xảy ra, bạn có thể liên hệ với team thông qua một trong các phương thức: email đến helloengnovate@gmail.com hoặc nhắn tin qua facebook.com/engnovate.
Vì toàn bộ công cụ trên website đều có thể sử dụng thử miễn phí, Engnovate không hỗ trợ hoàn tiền.