🔥 Today Only: Save 30% on Premium — Offer Ends Soon! - Upgrade Now!
Line Graph

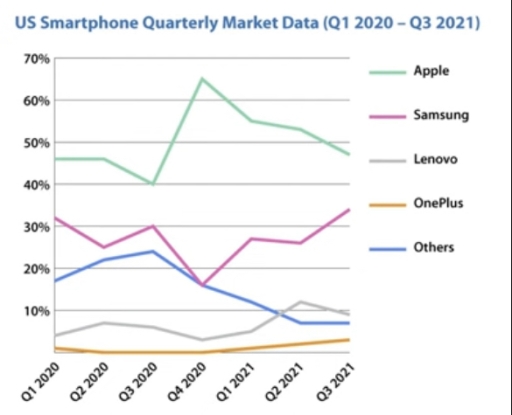
Band 5+: US smartphone quarterly market data from Q1 2020 to Q3 2021

Image for topic: US smartphone quarterly market data from Q1 2020 to Q3 2021
Our system will evaluate the answer based on this AI-generated description.
The image shows US Smartphone Quarterly Market Data from Q1 2020 to Q3 2021 for Apple, Samsung, Lenovo, OnePlus, and Others. Q1 2020: Apple about 47%, Samsung 32%, Lenovo 9%, OnePlus just under 5%, Others about 8%. Q2 2020: Apple spikes to nearly 65%, Samsung drops to about 23%, Lenovo just under 5%, OnePlus around 3%, Others around 5%. Q3 2020: Apple drops to about 53%, Samsung up to 28%, Lenovo still just under 5%, OnePlus dips to around 2%, Others up to 14%. Q4 2020: Apple around 50%, Samsung about 30%, Lenovo and OnePlus around 4% each, Others about 12%. Q1 2021: Apple drops to about 42%, Samsung rises to 35%, Lenovo stays around 4%, OnePlus up to nearly 6%, Others just over 12%. Q2 2021: Apple rises to 46%, Samsung drops to 33%, Lenovo remains around 4%, OnePlus stays near 6%, Others about 12%. Q3 2021: Apple around 45%, Samsung 34%, Lenovo 4%, OnePlus just under 6%, Others just over 12%.
Given the complexity of the image, the above description may not be entirely accurate.
Note: Both the topic and the answer were created by one of our users.

The graph illustrates the data of smartphone quarterly market between 2020 and 2021, over the course of a year. Between Apple, Samsung , Lenovo, OnePlus and including other smartphone brands.

To begin with, we can observe that Apple has the highest staying constant at roughly around 45%, then with a slight decrease starting from Q2 2020 till Q3. Then increased significantly between Q3 to Q4 2020. In addition to starting to decrease again smoothly. We can further see that Samsung declines or increases between each quarter, showing the peak being around 31%, and minimum of 25%. Furthermore, other smartphone increases just to decrease and stay still, reaching Samsungs range at approximately Q4 2020. While Lenovo and OnePlus stay lower than 10% throughout the year, only Lenovo going slightly over that mark.

This shows us that the two most successful are Apple and Samsung selling the most at markets. Meanwhile Lenovo, OnePlus, and other smartphones unable to pass the 35% park.

Word Count: 160

Answers On The Same Topic:

US smartphone quarterly market data from Q1 2020 to Q3 2021

THE LINE GRAPH COMPARES SMARTPHONE QUARTERLY MARKET DATA IN THE US BETWEEN Q1 2020 AND Q3 2021. OVERALL, APPLE AND SAMSUNG EXPERIENCED THE MOST FLUCTUATIONS, LENOVO ENCOUNTERED LESS DIFFERENCES, WHEREAS ONEPLUS REMAIND RELATIVELY STEADY, OTHERS INITIALLY HAD AN INCREASE BUT DECREASED TOWARDS THE END. APPLE STAYED CONSTANT TILL Q2 2020 AT ABOUT 45% THEN SHARPLY […]

US smartphone quarterly market data from Q1 2020 to Q3 2021

The line graph represents a US smartphone per quarterly market data from 2020 to 2021. The sales are in percentages. Overall, apple sales saw the highest sales throughout the period while oneplus grew the least. However, it is evident that samsung and lenovo flactuated in all the quarters. For starters, the most unpopular smartphone is […]

US smartphone quarterly market data from Q1 2020 to Q3 2021

A glance at the given line chart illustrates a number of striking fluctuations in the market of the US smartphones from Q1 2020 to Q3 20201. Overall, One fascinating fact highlighted by the figure is that Apple goods fluctuated significantly during this period and initial was a little under a half in Q1 2020; even […]

US smartphone quarterly market data from Q1 2020 to Q3 2021

A glance at the given line charts illustrates some striking fluctuations in the market of US smartphones from the first quarter of 2020 to the third quarter of 2021. Overall, Apple company had the highest data in this period. By contrast, Oneplus and Lenovo had the most minor data with a steady trend. In the […]

See All

Other Topics:

The chart below shows the percentage of households with different kinds of technology in the UK from 1997 to 2001. Summarise the information by selecting and reporting the main features, and make comparisons where relevant.

The linegraph illustrates many technology ownership in the UK households between 1997 and 2001. Overall, the ownership of all five technologies increased. CD players were the most popular technology throughout the period while the other technologies experienced the growth. In 1997, CD players were 60% of households. This figure grew steadily every year and reached […]

The graph shows the average attendance at football matches in three European countries between 1980 and 2004

The line graph illustrates the average attendance per top-level football match in three European countries, namely Italy, England, and Germany from 1980 to 2004. Overall, the average rate of attendance per high-level football match in Italy experienced a downward trend over the period, while the reverse was true for England Germany. Notably, England and Germany […]

The chart below presents information on the annual revenues of three department stores in a UK city from 2001 to 2015.

The chart provides information about the annual revenues of three department stores in a UK city from 2001 to 2015. Overall, J&W has the most change out of three, whereas the other two follow similar patterns with each other. The most noticeable change in this graph is the big rise from 0 million pounds to […]

You should spend about 20 minutes on this task. Summarise the information by selecting and reporting the main features, and make comparison where relevant.

The line graph gives information about how many UK commuters travelled per day by three different vehicles including cars, buses and trains over a 60-year period from 1970 to 2030. Overall, there was an upward trend in the average number of UK commuters travelling each day by car and train, with the exception of the […]

You should spend about 20 minutes on this task. The line graph below shows the percentage of spending in Turkey, from 1960 to 2000. Summarise the information by selecting and reporting the main features, and make comparisons where relevant. You should write at least 150 words.

The table illustrates the expenditure of Turkey (in percentages) allocated to 5 different categories from 1960 to 2000. Overall, almost all categories witnessed a downward trend, with the exception of clothing. It is worth noticing that clothing became the leading share by the end of the period. In 1960, food consumption was the largest category, […]

The line graph below shows the percentage of spending in Turkey from 1960 to 2000

the table illustrates the expenses of turkey (in percentages) allocated to 5 different categories from 1960 to 2000. overall, almost all categories have witnessed a decreasing trend, with the exception of clothing, being the leading share by the end of the period. In 1960 Food consumption was largest category, accounting for 35%. However, it dropped […]

See All
We have detected unusual activity on your device.
Please verify your identity to continue.
Note: This verification step won't sign you in. If you have a premium account, please log in to access the service as usual.
Google/Gmail Verification
Or verify using Email/Code
We've sent a verification code to:
youremail@gmail.com (Not your email?)
Enter it below to complete the verification process.
Ensure your email address is correct, your inbox is not full, and you check your spam folder. If no email arrives, consider using an alternative email.
You will need a Premium plan to perform your action!
Note: If you already have a premium account, please log in to access our services as usual.

Plans & Pricing

Our mission is to make quality education accessible for everyone.
However, to keep our hardworking team running and this service alive, we genuinely need your support!
By opting for a premium plan, not only do you sustain us in achieving the mission, but you also unlock advanced features to enrich your learning experience.

Free

For learners who aren't pressed for time

What's included on Free
100+ Cambridge IELTS Tests
Instant IELTS Writing Task 1 & 2 Evaluation (2 times/month)
Instant IELTS Speaking Part 1, 2, & 3 Evaluation (2 times/month)
Instant IELTS Writing Task 1 & 2 Essay Generator (2 times/month)
500+ Dictation & Shadowing Exercises
100+ Pronunciation Exercises
Flashcards
Other Advanced Tools

Premium

For those serious about advancing their English proficiency, and for IELTS candidates aspiring to boost their band score by 1-2 points (especially in writing & speaking) in just 30 days or less

What's included on Premium
Save Your IELTS Test Progress & Analyze Mistakes By Question Type
Save Your Own Flashcard Sets & Use Them On Any Device
Unlock All Courses, IELTS Tests, Section & Part Practice
Unlimited AI Conversations
Unlimited AI Writing Enhancement Exercises
Unlimited IELTS Writing Task 1 & 2 Evaluation
Unlimited IELTS Speaking Part 1, 2, & 3 Evaluation
Checked Answers Will Not Be Published
Unlimited IELTS Writing Task 1 & 2 Essay Generator
Unlimited IELTS Speaking Part 1, 2, & 3 Sample Generator
Unlimited Usage Of Advanced Tools & AI Features
Priority Support within 24h (12-month plan only)

Due to the nature of our service and the provided free trials, payments are non-refundable.