🔥 Today Only: Save 30% on Premium — Offer Ends Soon! - Upgrade Now!
Line Graph

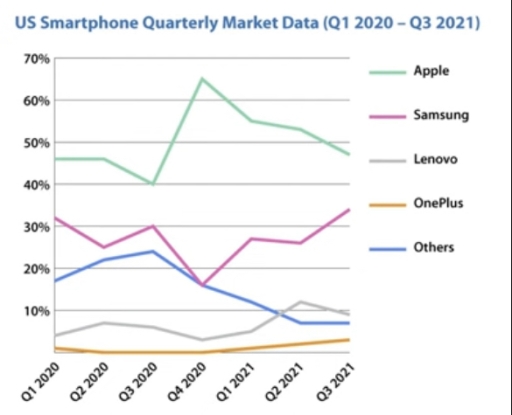
Band 5+: US smartphone quarterly market data from Q1 2020 to Q3 2021

Image for topic: US smartphone quarterly market data from Q1 2020 to Q3 2021
Our system will evaluate the answer based on this AI-generated description.
The image shows US Smartphone Quarterly Market Data from Q1 2020 to Q3 2021 for Apple, Samsung, Lenovo, OnePlus, and Others. Q1 2020: Apple about 47%, Samsung 32%, Lenovo 9%, OnePlus just under 5%, Others about 8%. Q2 2020: Apple spikes to nearly 65%, Samsung drops to about 23%, Lenovo just under 5%, OnePlus around 3%, Others around 5%. Q3 2020: Apple drops to about 53%, Samsung up to 28%, Lenovo still just under 5%, OnePlus dips to around 2%, Others up to 14%. Q4 2020: Apple around 50%, Samsung about 30%, Lenovo and OnePlus around 4% each, Others about 12%. Q1 2021: Apple drops to about 42%, Samsung rises to 35%, Lenovo stays around 4%, OnePlus up to nearly 6%, Others just over 12%. Q2 2021: Apple rises to 46%, Samsung drops to 33%, Lenovo remains around 4%, OnePlus stays near 6%, Others about 12%. Q3 2021: Apple around 45%, Samsung 34%, Lenovo 4%, OnePlus just under 6%, Others just over 12%.
Given the complexity of the image, the above description may not be entirely accurate.
Note: Both the topic and the answer were created by one of our users.

The line graph represents a US smartphone per quarterly market data from 2020 to 2021. The sales are in percentages.

Overall, apple sales saw the highest sales throughout the period while oneplus grew the least. However, it is evident that samsung and lenovo flactuated in all the quarters.

For starters, the most unpopular smartphone is oneplus as it dropped from around 2% sales in quarter one in 2020 to zero in quarter 2 through to quarter 4, 2020. It then rose slightly to approximately 4% at the end of the period. Similar to this trend are the samsung gadgets which dropped from around 32% in the first quarter in 2020 to about 25% in quarter 2, 2020 then rose to 30% in quarter 3, 2020. However, if plummeted to about 17% in quarter 4, 2020, increased sharpely again to around 28% in first quarter 2021, levelled off the following quarter and finally rose to about 34% in the last quarter in 2021.

There was no sales of apple phones in te first and second quarter 2020 asit stagnated at about 47%. It the dropped to 40% in te third quarter same year. The sales peaked at about 65% in the forth quarter in 2020 then dropped steadily to about 48% at the end of the period.

Word Count: 216

Answers On The Same Topic:

US smartphone quarterly market data from Q1 2020 to Q3 2021

THE LINE GRAPH COMPARES SMARTPHONE QUARTERLY MARKET DATA IN THE US BETWEEN Q1 2020 AND Q3 2021. OVERALL, APPLE AND SAMSUNG EXPERIENCED THE MOST FLUCTUATIONS, LENOVO ENCOUNTERED LESS DIFFERENCES, WHEREAS ONEPLUS REMAIND RELATIVELY STEADY, OTHERS INITIALLY HAD AN INCREASE BUT DECREASED TOWARDS THE END. APPLE STAYED CONSTANT TILL Q2 2020 AT ABOUT 45% THEN SHARPLY […]

US smartphone quarterly market data from Q1 2020 to Q3 2021

The graph illustrates the data of smartphone quarterly market between 2020 and 2021, over the course of a year. Between Apple, Samsung , Lenovo, OnePlus and including other smartphone brands. To begin with, we can observe that Apple has the highest staying constant at roughly around 45%, then with a slight decrease starting from Q2 […]

US smartphone quarterly market data from Q1 2020 to Q3 2021

A glance at the given line chart illustrates a number of striking fluctuations in the market of the US smartphones from Q1 2020 to Q3 20201. Overall, One fascinating fact highlighted by the figure is that Apple goods fluctuated significantly during this period and initial was a little under a half in Q1 2020; even […]

US smartphone quarterly market data from Q1 2020 to Q3 2021

A glance at the given line charts illustrates some striking fluctuations in the market of US smartphones from the first quarter of 2020 to the third quarter of 2021. Overall, Apple company had the highest data in this period. By contrast, Oneplus and Lenovo had the most minor data with a steady trend. In the […]

See All

Other Topics:

The chart below shows the amount of money spent on fast food each week in Lakeville.

Society has been addicted to fast food for a while.People do not think about their health ad mental issues.Humans suppose that consuming lots of unhealthy products will be enabled to harm their lifestyles.For instance,by 2000 pizza had become the largest bought meal and fried chicken had become the least bought. Ordering a lot of fast […]

The line graph below shows the average monthly rainfall in four cities around the world from 2010 to 2020. Summarise the information by selecting and reporting the main features, and make comparisons where relevant.

The provided line graph illustrates the average monthly rainfall in four specific cities over a span of 10 years between 2010 and 2020. Overall, Sydney emerged as the dominant recipient of rainfall throughout the period, consistently surpassing other cities. Meanwhile New York experienced less rainfalls. It intersected with Sydney in 2015 before separating ways. London […]

The chart below shows the average cost of a monthly contract from four different mobile phone providers in a European country

The mutiple line chart brings the information of the average cost of a monthly from four different mobile phone suppliers in a European country. Overall, it is clear that figures for Lex and Alpha increased over the period, while the opposite trend was seen in Domo and Sim TX. In addition, Alpha remained the highest […]

The graph below describes the use of fixed telephone lines, mobile phones, and internet between 1994 and 2005 in China. Summarise the information by selecting and reporting the main features, and make comparisons where relevant.

The given line graph illustrates the changes in the use of different means of communication – fixed telephone lines, mobile phones, and the internet – in China between 1994 and 2005. Overall, the use of diverse communication channels adhered to rising trends, albeit to varying degrees. While mobile phones generally had the highest number of […]

The line graph shows the percentage of New Zealand population from 1950 to 2050. Summarize the information by selecting and reporting the main features and make comparisons where relevant.

The line graph illustrates the proportion of the population in New Zealand in a century between 1950 and 2050. Overall, people in the age of 0 to 14 years old and 38 to 45 years old recorded an upward trend, while the remaining groups experienced the opposite. In details, the elderly was and will be […]

The chart below shows the percentage of households in a city with access to four types of modern technology from 2000 to 2020. Summarize the information by selecting and reporting the main features, and make comparisons where relevant.

The line graph compares the percentages of households in a country that had access to the internet, mobile phones and landline phones between 2000 and 2020. Overall, access to the internet and mobile phones increased substantially over the period, whereas the proportion of households with landline phones declined. By 2020, mobile phones were the most […]

See All
We have detected unusual activity on your device.
Please verify your identity to continue.
Note: This verification step won't sign you in. If you have a premium account, please log in to access the service as usual.
Google/Gmail Verification
Or verify using Email/Code
We've sent a verification code to:
youremail@gmail.com (Not your email?)
Enter it below to complete the verification process.
Ensure your email address is correct, your inbox is not full, and you check your spam folder. If no email arrives, consider using an alternative email.
You will need a Premium plan to perform your action!
Note: If you already have a premium account, please log in to access our services as usual.

Plans & Pricing

Our mission is to make quality education accessible for everyone.
However, to keep our hardworking team running and this service alive, we genuinely need your support!
By opting for a premium plan, not only do you sustain us in achieving the mission, but you also unlock advanced features to enrich your learning experience.

Free

For learners who aren't pressed for time

What's included on Free
100+ Cambridge IELTS Tests
Instant IELTS Writing Task 1 & 2 Evaluation (2 times/month)
Instant IELTS Speaking Part 1, 2, & 3 Evaluation (2 times/month)
Instant IELTS Writing Task 1 & 2 Essay Generator (2 times/month)
500+ Dictation & Shadowing Exercises
100+ Pronunciation Exercises
Flashcards
Other Advanced Tools

Premium

For those serious about advancing their English proficiency, and for IELTS candidates aspiring to boost their band score by 1-2 points (especially in writing & speaking) in just 30 days or less

What's included on Premium
Save Your IELTS Test Progress & Analyze Mistakes By Question Type
Save Your Own Flashcard Sets & Use Them On Any Device
Unlock All Courses, IELTS Tests, Section & Part Practice
Unlimited AI Conversations
Unlimited AI Writing Enhancement Exercises
Unlimited IELTS Writing Task 1 & 2 Evaluation
Unlimited IELTS Speaking Part 1, 2, & 3 Evaluation
Checked Answers Will Not Be Published
Unlimited IELTS Writing Task 1 & 2 Essay Generator
Unlimited IELTS Speaking Part 1, 2, & 3 Sample Generator
Unlimited Usage Of Advanced Tools & AI Features
Priority Support within 24h (12-month plan only)

Due to the nature of our service and the provided free trials, payments are non-refundable.