Our system will evaluate the answer based on this AI-generated description.
The image shows a line graph from 1988 to 2014 with four categories: "Company Shares," "Fine Art," "Gold," and "Property." In 1988 all values start slightly above 0. By 1992, gold and company shares reached slightly above 50, fine art stayed below 50, and property remained steady. By 1996, gold slightly dipped under other sectors; in 2000, gold and company shares both near 100, property slightly increased. By 2004, gold led around 130, company shares approximately 130, fine art reached near 100, property under 100. In 2008, gold soared to 200, company shares around 150, property rises above 100, fine art slightly below gold. By 2010, gold spikes sharply to 400, company shares at 200, property around 150, fine art just over 100. In 2012, gold peaks over 450, company shares near 300, property approaches 200, fine art above 150. By 2014, gold decreases slightly under 400, company shares over 300, property aligns close to 200, fine art steady around 200.
Given the complexity of the image, the above description may not be entirely accurate.
Skyrocket your IELTS band score by 1-2 points in under a month with our premium plan!
Note: Both the topic and the answer were created by one of our users.
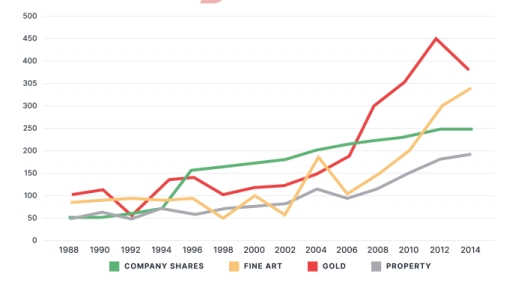
this line graph shows the amount of money invested in four diffrent types of categories from 1988 to 2014
overall investent in gold and company shares increesed significantly over the period. gold shows the more growth, particularly in the later year property and the fine art rose gradually
in 1988 gold had a biggest investment 100 million dollars property had the lowest around 50 million. company shares starded at the 60 million. it went up slowleya and reached 150 million in 1996. after that it kept increasing and reached 250 million in 2014. property also increased slowley from 50 million to almost 200 million at the end
fine art went down little in 1990s, but later it started to go up again, after 2006 it went up again and reached at 320 million in 2014 , gold changed up and down before 2006. then it increesed very fast and went up the higgest growth 450 million dollars in 2012, after it fell little around 350 million in the 2014
Word Count: 169