🔥 Today Only: Save 30% on Premium — Offer Ends Soon! - Upgrade Now!
Multiple Graphs

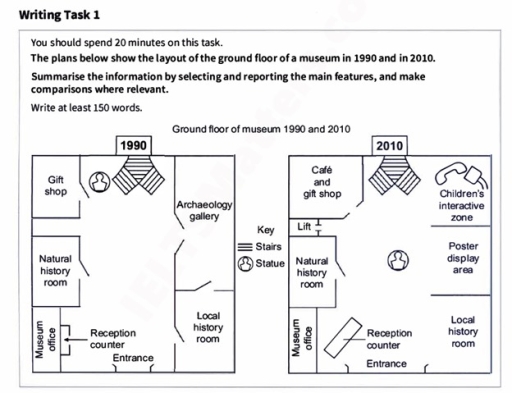
Band 8+: You Should spend 20 minutes on this task. The plans below show the layouts of the ground floor of a museum in 1990 and in 2010 Summarize the information by selecting and reporting the main features, and make comparisons where relevant Write at least 150 words

Image for topic: You Should spend 20 minutes on this task. The plans below show the layouts of the ground floor of a museum in 1990 and in 2010 Summarize the information by selecting and reporting the main features, and make comparisons where relevant Write at least 150 words
Our system will evaluate the answer based on this AI-generated description.
The image displays two floor plans of a museum's ground floor for the years 1990 and 2010. In 1990, starting from the left and moving clockwise, the layout includes: Museum & Reception counter, Entrance, Local History room, Natural History room, Archaeology gallery, and Gift Shop. Notable features indicated are a Statue in the Archaeology gallery and Stairs near the Local History Room. In 2010, the configuration from the left moving clockwise includes: Museum & Reception Counter, Entrance, Local History Room, Poster Display Area, Children’s Interactive Zone, Café & Gift Shop, and a Natural History Room. Additional features are a Lift positioned near the Natural History Room and stairs near the Local History Room. The Statue present in the 1990 Archaeology Gallery is absent in the 2010 layout, and significant changes include the transformation of the Archaeology Gallery into the Poster Display Area and the Gift Shop being merged with a Café.
Given the complexity of the image, the above description may not be entirely accurate.
Note: Both the topic and the answer were created by one of our users.

The maps illustrate the layout of the ground floor of a museum in 1990 and 2010, highlighting significant changes over the two decades.

Overall, the museum’s ground floor underwent several notable transformations, including the addition of new facilities, the relocation of key objects, and the removal of some partitions, creating a more open and modern space.

In detail, the left side of the museum saw the gift shop expanded into a café and gift shop combined, and a lift was installed adjacent to it. The statue, which was initially located near the entrance, was moved to the center of the museum, becoming a focal point for visitors. The reception counter, previously located at the entrance, was relocated in front of the museum office, streamlining the entrance area. The natural history room on the left side remained unchanged.

On the right side, significant changes were made. The space previously occupied by the archaeology gallery was divided into two areas: a children’s interactive zone, placed near the stairs, and a poster display area beside the central statue. The local history room remained in the same position as in 1990, situated in the right front corner of the museum.

Word Count: 196

Answers On The Same Topic:

You Should spend 20 minutes on this task. The plans below show the layouts of the ground floor of a museum in 1990 and in 2010 Summarize the information by selecting and reporting the main features, and make comparisons where relevant Write at least 150 words

The map illustrates the changes made to the ground floor of a museum between 1990 and 2010. Overall, the layout of the displayed area underwent only minor adjustments. Most of the ground floor facilities remained in their original locations. The Natural History Room, museum office, and gift shop continued to occupy the left side of […]

You Should spend 20 minutes on this task. The plans below show the layouts of the ground floor of a museum in 1990 and in 2010 Summarize the information by selecting and reporting the main features, and make comparisons where relevant Write at least 150 words

The maps give information about how the ground floor of a museum has changed between 1990 and 2010. Overall, the area has experienced significant transformation, with notable developments in infrastructure facilities, while some features, such as the natural history room, museum office, and local history room, remained unchanged. Prior to the development, there were stairs […]

You Should spend 20 minutes on this task. The plans below show the layouts of the ground floor of a museum in 1990 and in 2010 Summarize the information by selecting and reporting the main features, and make comparisons where relevant Write at least 150 words

The maps illustrate how the ground floor of a museum changed from 1990 to 2010. Overall, the most significant alteration is the location of the statue and the archaeology gallery is converted by some amenities. It is also clear that the natural history room, museum office, local history room and stairs remained the same after […]

You Should spend 20 minutes on this task. The plans below show the layouts of the ground floor of a museum in 1990 and in 2010 Summarize the information by selecting and reporting the main features, and make comparisons where relevant Write at least 150 words

The given layout compares the ground floor of a museum in terms of changes in 1990 and 2010. From an overall perspective, it is clear that the museum had become more modernized, with the addition of new facilities. Looking at the western side of the map, a gift shop in the north-western corner had been […]

You Should spend 20 minutes on this task. The plans below show the layouts of the ground floor of a museum in 1990 and in 2010 Summarize the information by selecting and reporting the main features, and make comparisons where relevant Write at least 150 words

In 1990, the proposal included a gift shop, an archaeology gallery, a natural history room, a local history room, and a reception counter. The archaeology gallery was in a large space, and the gift shop was a separate space. The museum office was at the entrance, and the access was primarily through stairs. By 2010, […]

See All

Other Topics:

The table shows the number of internet users (in millions) in different countries, while the bar chart illustrates the percentage of internet usage by age group. Summarise the information by selecting and reporting the main features, and make comparisons where relevant.

he table illustrates the figure for people who used the internet in millions across 6 different countries, while the bar chart depicts the proportion of internet usage by age groups. Overall, it is clear that China had the largest number of internet users, whereas the UK was opposite. Additionally, the percentage of people who used […]

The pie charts below show the percentage of students at one adult education centre taking various courses offered in 1985 and this year. Summarise the information by selecting and reporting the main features, and make comparisons where relevant.

The provided pie charts delineate the proportion of students on the one adult center attending different courses provided in 1985 and this year. Overall, the modern languages and art sectors witnessed an overall downward trend over the period, while the cookery sector experienced a dramatic increase throughout the period. Meanwhile, fitness and dance remained relatively […]

The pie chart shows the the expenditure of the people of a country on different activities in 2000 and 2010. Summarize information by slelting and reporting the mein features and comparison where relevant.

The pie chart illustrates the percentage of people in a particular country who spend their money on different activities. Overall, people spend by far the largest proportion of their money on travelling, while footwear and clothing and health accounted for the smallest persentages. The remaining money were distributed among a variety of sectors with education, […]

The bar chart below shows the percentage of households with access to the internet in a European country between 2010 and 2020. The pie chart illustrates the proportions of different age groups that used online shopping services in the same country in 2020. Summarise the information by selecting and reporting the main features, and make comparisons where relevant.

The given bar chart compares the proportion of households with access to the internet in a specific EU nation over a 10-year span from 2010 to 2020, while the pie chart demonstrates the percentage of different age brackets that used online shopping services in the same country in 2020. Overall, it is clear that households […]

The bar chart below shows the percentage of households with access to the internet in a European country between 2010 and 2020. The pie chart illustrates the proportions of different age groups that used online shopping services in the same country in 2020. Summarise the information by selecting and reporting the main features, and make comparisons where relevant.

The given bar chart compares the proportion of individuals of different age brackets who used the internet for shopping in a specific EU country over a 10-year span from 2015 to 2025. Overall, it is clear that all figures showed an upward trajectory throughout the period. It is also evident that youngest demographic had the […]

The chart and gragh below give information about participants who have entered the Olympics since it began

The two charts give information about the number of male and female participants in the Olympic Games in 1924, 1952, 1984 and 2012. The bar chart compares the number of men and women, while the line graph shows the total number of participants in these years. Overall, it can be seen that the number of […]

See All
We have detected unusual activity on your device.
Please verify your identity to continue.
Note: This verification step won't sign you in. If you have a premium account, please log in to access the service as usual.
Google/Gmail Verification
Or verify using Email/Code
We've sent a verification code to:
youremail@gmail.com (Not your email?)
Enter it below to complete the verification process.
Ensure your email address is correct, your inbox is not full, and you check your spam folder. If no email arrives, consider using an alternative email.
You will need a Premium plan to perform your action!
Note: If you already have a premium account, please log in to access our services as usual.

Plans & Pricing

Our mission is to make quality education accessible for everyone.
However, to keep our hardworking team running and this service alive, we genuinely need your support!
By opting for a premium plan, not only do you sustain us in achieving the mission, but you also unlock advanced features to enrich your learning experience.

Free

For learners who aren't pressed for time

What's included on Free
100+ Cambridge IELTS Tests
Instant IELTS Writing Task 1 & 2 Evaluation (2 times/month)
Instant IELTS Speaking Part 1, 2, & 3 Evaluation (2 times/month)
Instant IELTS Writing Task 1 & 2 Essay Generator (2 times/month)
500+ Dictation & Shadowing Exercises
100+ Pronunciation Exercises
Flashcards
Other Advanced Tools

Premium

For those serious about advancing their English proficiency, and for IELTS candidates aspiring to boost their band score by 1-2 points (especially in writing & speaking) in just 30 days or less

What's included on Premium
Save Your IELTS Test Progress & Analyze Mistakes By Question Type
Save Your Own Flashcard Sets & Use Them On Any Device
Unlock All Courses, IELTS Tests, Section & Part Practice
Unlimited AI Conversations
Unlimited AI Writing Enhancement Exercises
Unlimited IELTS Writing Task 1 & 2 Evaluation
Unlimited IELTS Speaking Part 1, 2, & 3 Evaluation
Checked Answers Will Not Be Published
Unlimited IELTS Writing Task 1 & 2 Essay Generator
Unlimited IELTS Speaking Part 1, 2, & 3 Sample Generator
Unlimited Usage Of Advanced Tools & AI Features
Priority Support within 24h (12-month plan only)

Due to the nature of our service and the provided free trials, payments are non-refundable.
Nếu bạn là người Việt Nam và không có hoặc không muốn trả bằng credit/debit cards, bạn có thể thanh toán bằng phương thức chuyển khoản:


Chọn gói:
419,000₫ 277,000 ₫ cho gói 1 tháng (chỉ 9,233₫/ngày)
1,239,000₫ 597,000 ₫ cho gói 3 tháng (chỉ 6,633₫/ngày)
2,469,000₫ 1,027,000 ₫ cho gói 6 tháng (chỉ 5,706₫/ngày)
4,929,000₫ 1,417,000 ₫ cho gói 12 tháng (chỉ 3,936₫/ngày)


Sau khi chuyển khoản, vui lòng đợi trình duyệt tự động điều hướng bạn trở lại Engnovate và bạn sẽ ngay lập tức nhận được mã kích hoạt tài khoản premium.
Nếu có lỗi xảy ra, bạn có thể liên hệ với team thông qua một trong các phương thức: email đến helloengnovate@gmail.com hoặc nhắn tin qua facebook.com/engnovate.
Vì toàn bộ công cụ trên website đều có thể sử dụng thử miễn phí, Engnovate không hỗ trợ hoàn tiền.