Our system will evaluate the answer based on this AI-generated description.
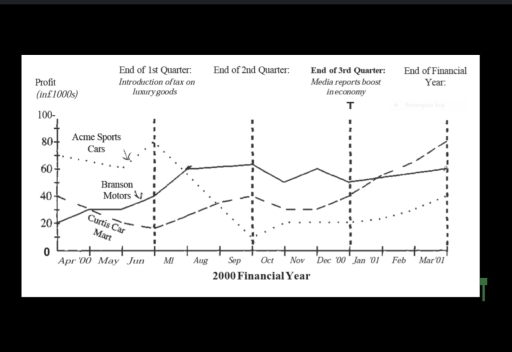
The image displays a line graph of Profit (in £1000s) vs. time for the 2000 Financial Year (Apr '00 to Mar '01) for three companies. Data for Acme Sports Cars (in £1000s) is: Apr '00 70, May '00 68, Jun '00 62, Jul '00 54, Aug '00 30, Sep '00 10, Oct '00 18, Nov '00 20, Dec '00 22, Jan '01 22, Feb '01 28, Mar '01 40. Data for Branson Motors is: Apr '00 40, May '00 32, Jun '00 28, Jul '00 61, Aug '00 60, Sep '00 62, Oct '00 49, Nov '00 60, Dec '00 52, Jan '01 50, Feb '01 58, Mar '01 60. Data for Curtis Car Mart is: Apr '00 20, May '00 25, Jun '00 18, Jul '00 18, Aug '00 28, Sep '00 40, Oct '00 32, Nov '00 30, Dec '00 38, Jan '01 52, Feb '01 64, Mar '01 88. Annotations on the timeline indicate 'End of 1st Quarter: Introduction of tax on luxury goods', 'End of 2nd Quarter', 'End of 3rd Quarter: Media reports boost in economy', and 'End of Financial Year'.
Given the complexity of the image, the above description may not be entirely accurate.
Skyrocket your IELTS band score by 1-2 points in under a month with our premium plan!
Note: Both the topic and the answer were created by one of our users.
The data presents the percentage of 4 distinct materials that were recycled between 1982 and 2010 in specific countries
Overall, Paper and carboard had the highest percentage of recycling rate cmaird amoung the 4 classes displayed in ther graph. However other tree class overall increased In rate, while plastic and paer decreased in rate .
The processing rate of Ppaper and carboard remained approximates stable around the 65 to 70% range till 1990, during the same period, rate of Glass container generally decreased to 40 percent . Both had their highest percentage increase between 1990 and 1994. The rate then declined for paper and cardboard form 1994 till the end of the perod, while at the same time rate of Glass containers increased
Both rates of Aluminium cans and Plastics started in 1986 and 1990 respectivly. There was a general growth observed in alumininium contaniner between 1990 and 2010, with the highest percentqage change occurring on 2002. It is also observed that plastic had a small incline thoroughout its period, with it haiving the smallest rate changes amoung the 4 classes.
Word Count: 181