Our system will evaluate the answer based on this AI-generated description.
The image displays two pieces of statistical information. The first is a table titled "Sectoral distribution of employment and GDP, 1992", subdivided into sectors: Natural Resources, Industry, Trade, Restaurants, Hotels, Transport Services, Communication, Government, Other, and a Total column. Employment percentages are as follows: Natural Resources 77.4%, Industry 3.6%, Trade Restaurants Hotels 4.9%, Transport Services Communication 1.6%, Government 8.7%, Other 3.8%, Total 100.0%. GDP percentages are given: Natural Resources 19.2%, Industry 15.4%, Trade, Restaurants, Hotels 37.1%, Transport Services Communication 8.4%, Government 12.5%, Other 7.4%, Total 100.0%. The second part of the image is a line graph with the x-axis showing years from 1986 to 1995 and the y-axis indicating percentage of GDP, depicting three lines labeled Services, Natural resources, and Industry. The Services line is consistently above approximately 55%, the Natural Resources line shows a slight decline starting just below 25% and finishing around 22%, and the Industry line begins just above 20% and ends slightly above 15%.
Given the complexity of the image, the above description may not be entirely accurate.
Skyrocket your IELTS band score by 1-2 points in under a month with our premium plan!
Note: Both the topic and the answer were created by one of our users.
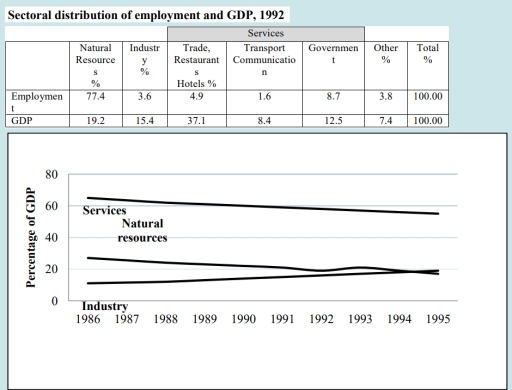
The graphs illustrate the distribution of employment in six different sectors and its correlates with the ratio of Gross Domestic Product ( GDP) generated by each one in a developing country in 1992, and how the percentage of GDP in three different sectors changed over the years 1986-1995.
Overall, the vast majority of workers, about two thirds, in 1992 is employed in natural resource, giving rise to one fifth of the GDP. It is worth noting that, despite being a huge minority, workers in Industry give rise to 15% of GDP in the same year. Services, like restaurants , hotels, transports and government offices, give employment to about 16% of workers , creating most of the GDP in that years. Notably, however, 3.8% of people is employed in others sectors, contributing to 7.4% of GDP.
Looking closer the temporal changes over a decade, it is clear that both services and natural resources workers contributes less and less to the GDP, even if the share of services is still preponderant at the end of the considered period. The ratio of GDP generated by industry rises steadily, and overtook natural resources by the end of 1994
Word Count: 194
