Our system will evaluate the answer based on this AI-generated description.
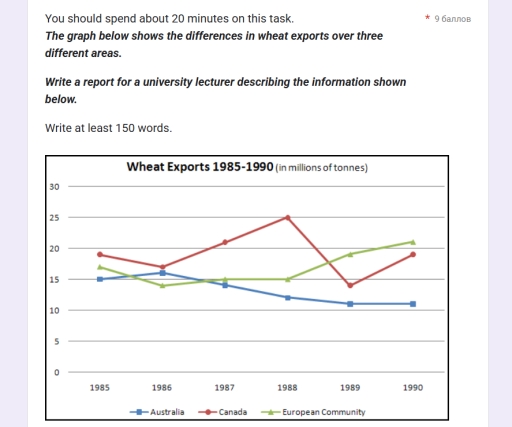
The image displays a line graph comparing wheat exports in millions of tonnes for Australia, Canada, and the European Community from 1985 to 1990. In 1985, Australia exported 15 million tonnes, Canada exported 19 million tonnes, and the European Community exported 17 million tonnes. In 1986, Australia's exports decreased to 11 million tonnes, Canada's remained at 18 million tonnes, and the European Community's rose to 19 million tonnes. In 1987, Australia exported 12 million tonnes, Canada increased to 20 million tonnes, and the European Community slightly decreased to 15 million tonnes. By 1988, Australia's exports remained at 11 million tonnes, Canada's increased significantly to 25 million tonnes, while the European Community increased to 18 million tonnes. In 1989, Australia's exports fell to 10 million tonnes, Canada decreased sharply to 19 million tonnes, and the European Community rose to 21 million tonnes. Finally, in 1990, Australia exported 12 million tonnes, Canada's exports rose slightly to 20 million tonnes, and the European Community's exports decreased to 16 million tonnes.
Given the complexity of the image, the above description may not be entirely accurate.
Skyrocket your IELTS band score by 1-2 points in under a month with our premium plan!
Note: Both the topic and the answer were created by one of our users.
The image is a line graph that illustrates the differences and the changes in wheat exports over three different areas ,Australia,Canada and European community in the period between 1985 and 1990.
It is clear that the Canadian community was by far the highest wheat exporters over the period shown while Australians have the lowest rate of wheat export
In 1985,Canadians were the top one exporter of the wheat , with around 19 millions of tonnes.Australians and the European community exported just under 18 millions of tonnes of wheat . just one year later , the export of wheat decreased in the three regions.
In 1988,wheat exportation has dramatically increased in the region of canada to 25 millions of tonnes, By contrast,the figure for the region of australia has tragically decreased to around 12 millions tonnes , while the European community remained stable at 15 millions of tonnes for a year.
Word Count: 150
