Our system will evaluate the answer based on this AI-generated description.
The image contains two visuals: a line graph showing "Money spent on crop protection" by region and a bar chart detailing the "Area of land" affected by different types of damage to crops. In the line graph, for Australia, expenditures are 200 million in Jan-Mar, about 300 million in Apr-Jun, 350 million in Jul-Sep, and nearly 800 million in Oct-Dec. In Europe, expenditures are 600 million in Jan-Mar, 550 million in Apr-Jun, 450 million in Jul-Sep, and 400 million in Oct-Dec. In Africa, expenditures are 250 million in Jan-Mar, 350 million in Apr-Jun, 200 million in Jul-Sep, and 200 million in Oct-Dec. In the bar chart, floods impact 800 thousand hectares in Australia, 600 thousand in Europe, and 400 thousand in Africa. Insects affect 600 thousand hectares in Australia, 400 thousand in Europe, and 300 thousand in Africa. Fires affect 300 thousand hectares in Australia, 200 thousand in Europe, and 100 thousand in Africa.
Given the complexity of the image, the above description may not be entirely accurate.
Skyrocket your IELTS band score by 1-2 points in under a month with our premium plan!
Note: Both the topic and the answer were created by one of our users.
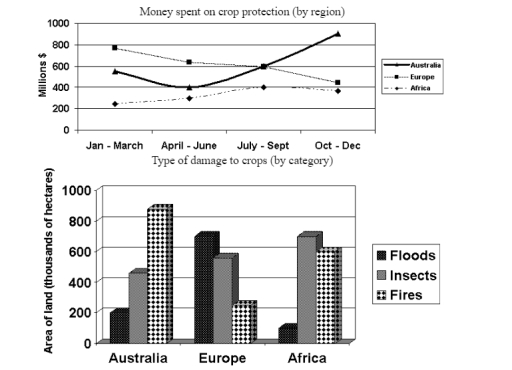
The line graph demonstrates the overall spending on crop protection, whereas the bar graph shows further catagorized the damage into Flood, Insects and Fire in Australia, Europe, and Africa in 2005. Overall, there is a fluctuation in the money spent on harvest protection, whereas the majority damage to crops is caused by fire in Australia, and the least damaged by floods in Africa.
The line graph showed fluctuation in the amount of money spent on protecting harvests. In Australia, there was a slight dip in the spending and spiked by the the of the year to around 8000 million dollars. Oppositely, the amount of money spent in Europe decreased gradually from approximately 800 to 410 million dollars. Similar to Australia, there was an incline in the total spending from January to September and slightly declined to almost 400 dollars.
Additionaly, the total damage caused by fires is around 800 hectares in Australia, making it the highest in the list followed by insects, and fire. On the other hand, floods cause the most destruction in Europe’s harvests at around 700 hectares. Conversely, insects had caused the most crops damage in Africa at approximately 700 hectares.
Word Count: 194
