Our system will evaluate the answer based on this AI-generated description.
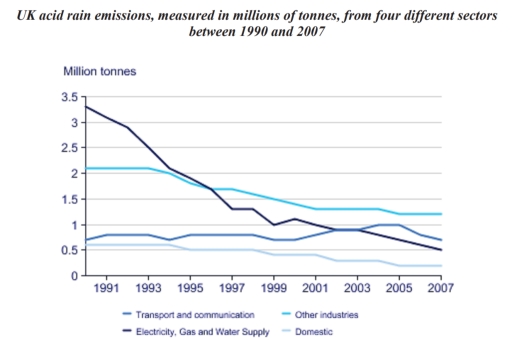
The image shows a line graph of UK acid rain emissions in million tonnes from four different sectors between 1990 to 2007. The graph displays four lines: Transport and communication, Other industries, Electricity, Gas and Water Supply, and Domestic. Transport and communication started at approximately 0.7 million tonnes in 1990, peaked at around 0.75 million tonnes in 1992, and declined to almost 0.5 million tonnes by 2007. Other industries began at 1 million tonnes in 1990, saw an increase to 1.1 million tonnes in 1991, and gradually decreased to just above 0.5 million tonnes by 2007. Electricity, Gas, and Water Supply had the highest value, starting at 3.1 million tonnes, experiencing a steep decline to 2.3 million tonnes in 1993, gradually decreasing to 1.6 million tonnes in 2007. The domestic sector started at 0.7 million tonnes and experienced a slight fluctuation within the 0.6-0.9 million tonnes range before ending at about 0.65 million tonnes in 2007.
Given the complexity of the image, the above description may not be entirely accurate.
Skyrocket your IELTS band score by 1-2 points in under a month with our premium plan!
Note: Both the topic and the answer were created by one of our users.
The provided line graph illustrates data regarding acid rain emissions in the UK from four diverse categories (Transport and Communication, Electricity, Gas and Water Supply, Other Industries, and Domestic) from 1990 to 2007. The emissions are measured in millions of tonnes.
Overall, after a meticulous investigation of the provided diagram, what can be noticed is that whilst Electricity, Gas and Water supply, Domestic and Other Industries followed a downward trajectory, the Transport and Communication remained constant.
To begin with, there was a significant decline in acid rain emissions across all segments during the given period.
The Electricity, Gas and Water Supply segment exhibited the highest emissions in 1990 but experienced the most substantial decline by 2007. In contrast, the Other Industries sector showed a constant reduction over the years. In 1996, both of them reached about 2 million tonnes.
Afterwards, in 2002, the Electricity, Gas and Water Supply field continued to decline and overlapped with the Transport and Communication field.
Word Count: 160
