Our system will evaluate the answer based on this AI-generated description.
The image contains a line graph detailing U.S. government spending on research from 1980 to 2008 across five categories: Health, Space, Energy, General Science, and Other. The y-axis represents expenditure in US dollars (billions), ranging from 0 to 25, and the x-axis symbolizes years, progressing from 1980 to 2008 in 4-year intervals. Health spending shows a stable increase from approximately 5 billion in 1980 to just under 10 billion in 1992, then a sharp rise to nearly 25 billion in 2004, before slightly declining in 2008. Space expenditure remains constant around 15 billion from 1980 until a peak at just over 15 billion in 1996, followed by a decline to approximately 5 billion in 2008. Energy spending starts close to 10 billion in 1980, declining to just under 5 billion in 1984, then fluctuates between 3 to 5 billion until 2008. General Science expenditure begins around 2 billion in 1980, gradually increasing to approximately 7 billion in 2008. The Other category shows a steady incline from around 2 billion in 1980 to 7 billion in 2008, with slight fluctuations.
Given the complexity of the image, the above description may not be entirely accurate.
Skyrocket your IELTS band score by 1-2 points in under a month with our premium plan!
Note: Both the topic and the answer were created by one of our users.
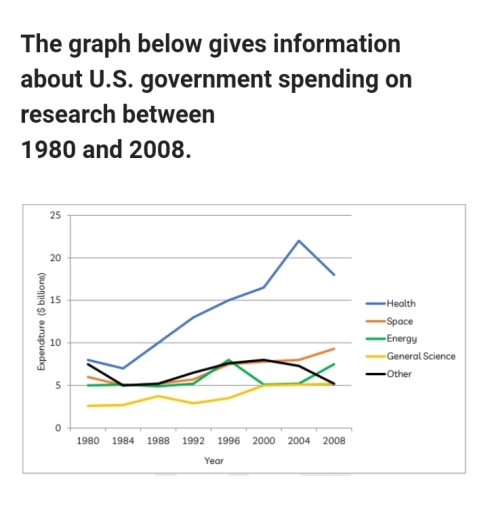
The image illustrates the U.S. government’s spending on research across various sectors from 1980 to 2008. The sectors include Health, Space, Energy, General Science, and Other.
From the graph, it is clear that spending on Health research experienced a significant increase over the years. Starting from a lower base in 1980, it rose steadily, peaking around 2004. This indicates a growing emphasis on health-related research over the decades. Similarly, expenditure on Space research also showed a gradual increase, although not as sharp as Health. This suggests a steady interest in space exploration and related technologies.
In contrast, spending on Energy, General Science, and Other sectors remained relatively stable. These sectors did not see the same level of investment growth as Health and Space. The expenditures on these areas showed minor fluctuations but no significant upward trend.
Overall, the graph indicates that the U.S. government has prioritized Health and Space research more than Energy, General Science, and Other sectors over this period. This reflects the government’s shifting priorities toward addressing health issues and exploring space.
Word Count: 174