Our system will evaluate the answer based on this AI-generated description.
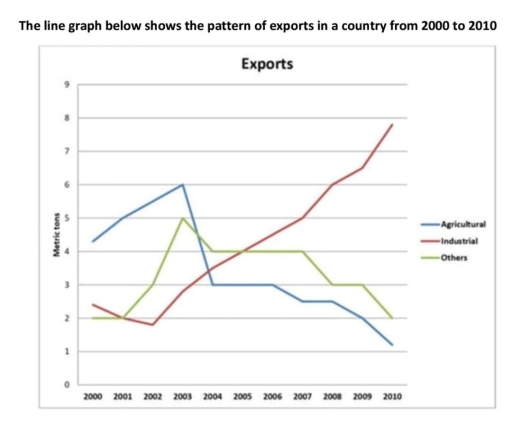
The image illustrates export metrics from 2000 to 2010 in three categories: Agricultural, Industrial, Others, measured in metric tons. In 2000, Agricultural exports were 3 metric tons, Industrial exports were 1 metric ton, and Others were 2 metric tons. By 2001, Agricultural increased to 5, Industrial to 2, and Others to 2. For 2002, Agricultural was 4, Industrial reached 3, and Others slightly declined to 3. In 2003, Agricultural dropped back to 3, Industrial was at 4, and Others also at 3. By 2004, Agricultural plummeted to 1, Industrial held steady at 4, Others at 4. In 2005, Agricultural was at 1, Industrial raised to 5, Others went to 5. For 2006, Agricultural saw a rise to 3, Industrial remained at 5, Others fell to 3. In 2007, Agricultural increased to 4, Industrial decreased to 4, Others dropped to 2. In 2008, Agricultural exports were 3, Industrial's were consistent at 5, and Others at 2. By 2009, Agricultural decreased further to 2, Industrial reached 7, Others were stable at 2. Finally, in 2010, Agricultural exports dropped to 1, Industrial surged to 8, and Others slightly decreased to 1 metric ton.
Given the complexity of the image, the above description may not be entirely accurate.
Skyrocket your IELTS band score by 1-2 points in under a month with our premium plan!
Note: Both the topic and the answer were created by one of our users.
The graph compares three kinds of exports in a country over ten years, from 2000 to 2010.
It can be seen that the proportion of agricultural exports increases dramatically and sharply falls in 2004, and still decreases until the end of the graph. Industry’s numbers also rise gradually during the same time period. Thegreen line, which represents ‘other’ exports, increases dramatically and starts to stabilize in 2004. Until 2008, the proportion of the green line decreases gradually.
According to the graph, the number of the blue line begins at approximately four and it increases up to six in 2004. In 2003, the percentage goes down. In the last year, the number of agricultural exports was approximately one. On the other hand, the proportion of industry and other exports was two and approximately two point five. Industry’s numbers also rise dramatically up to five and went down which intercepted with the rate of agricultural exports in 2004. Furthermore, the other exports drop downward to less than two in 2002. However, it increases significantly, which intercepted with the rate of industry in 2005.
Word Count: 181
