🔥 Today Only: Save 30% on Premium — Offer Ends Soon! - Upgrade Now!
Line Graph

Band 4+: the graph below shows the difference in wheat exports over three different areas. write a report for a university lecturer describing the information shown below. write at least 150 words.

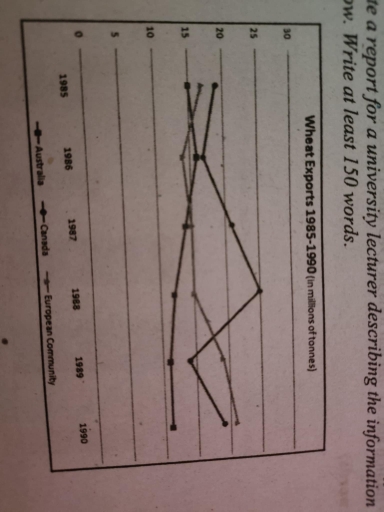
Image for topic: the graph below shows the difference in wheat exports over three different areas. write a report for a university lecturer describing the information shown below. write at least 150 words.
Our system will evaluate the answer based on this AI-generated description.
The image contains a graph depicting wheat exports (in millions of tonnes) from 1985-1990 for Australia, Canada, and the European Community. In 1985, Australia's exports were 15 million tonnes, Canada's were 19 million tonnes, and the European Community's were 13 million tonnes. In 1986, Australia's exports dropped to 11 million tonnes, Canada's fell to 17 million tonnes, and the European Community's slightly decreased to 12 million tonnes. In 1987, Australia exported 12 million tonnes, Canada 12 million tonnes, and the European Community 16 million tonnes. For 1988, Australia's exports rose sharply to 21 million tonnes, Canada's increased to 15 million tonnes, and the European Community's decreased slightly to 14 million tonnes. In 1989, Australia's exports were 18 million tonnes, Canada's slightly increased to 20 million tonnes, and the European Community peaked at 23 million tonnes. By 1990, Australia's exports increased to 22 million tonnes, Canada's dropped to 18 million tonnes, and the European Community's significantly fell to 12 million tonnes.
Given the complexity of the image, the above description may not be entirely accurate.
Note: Both the topic and the answer were created by one of our users.

The graph illustrate the difference between 3 territories that have wheat exports. The areas is: Australia, Canada, European Community. There are period from 1985 to 1990 years.

Overall, this process consist the stages, beggining with 1985 and ending with 1990. There is a 3 countries, and the 2 of them have stable moving and the another one it shows big chages.

The 2 countries that demonstrate the stable moving is Australia and European Community. Australia in 1986 year have increase his wheat export to little more than 1985 year. But in the next years the line goes down. European Community has opposite effect. At the start of the period it break down, after this the line grow up.

On the other point Canada have extremly different changes. It starts with fall to around 14 tonnes, and continue with extremely growing up in 1988 year. But after that, the line declines again and gradually soars.

Word Count: 154

Answers On The Same Topic:

the graph below shows the difference in wheat exports over three different areas. write a report for a university lecturer describing the information shown below. write at least 150 words.

The line graph compares three regions in terms of exports of wheat between 1985 and 1990. Overall, the three regions experienced different trends in the time period. While the two country canada and Europian communityrose with some fluctuation, Australia’s exports fell over time. As the graph shows, Australia’s export figure started 15 million tons of […]

the graph below shows the difference in wheat exports over three different areas. write a report for a university lecturer describing the information shown below. write at least 150 words.

The given line graph providea a breakdown of wheat export over the three areas. Overall, what stands out from the graph is that both Canada adn European Community saw a steady growth, while the Australia declined slighly. In the opening year, in 1985, European Community exported about 17 million tonnes of wheat, whereas Canada exported […]

the graph below shows the difference in wheat exports over three different areas. write a report for a university lecturer describing the information shown below. write at least 150 words.

The given line graph illustrates the disparities in Australia, Canada and European communitiy wheat exportation between 1985 and 1990. Overall, it is clear that all statics have an erratic trajectory. While Canada data dominated through most of the surveyed period, Australia number was at the other end. Regarding the amount of wheat Canada exported in […]

the graph below shows the difference in wheat exports over three different areas. write a report for a university lecturer describing the information shown below. write at least 150 words.

The chart illustrates the various wheat exports in three different areas in 1985 – 1990 (million tones) In an overview, it is evident that cannada had the highest peak of export of wheat in 1988 while Australia showed decrease towards 1990 In the case of Canada it showed a slight depth in 1986 then which […]

See All

Other Topics:

The graph below gives information about the number of jobs in four sectors of the economy in the US between 1960 and 2020. Summarise the information by selecting and reporting the main features, and make comparisons where relevant.

The line chart displays how many individuals were employed (in millions) in each of the four economic sectors – manufacturing, retail, agriculture, and health care – in the US at twenty-year intervals from 1960 to 2020. Broadly speaking, two contrasting trends can be identified in the figures: those for the retail and health care sectors […]

The chart below shows the percentage of Australian people who were born in different places of the world.

The given line graph gives data about the proportion of Australian people who were born in different parts of the earth between 1976 and 2011. Taken as a whole,it is clear that the proportion of Australian people who were born in Asia was the highes over the whole period.All of the figures except of UK […]

The graph below shows the number of international tourists visiting three different countries between 2000 and 2010.

The line graph outlines the data of international tourists visiting three separate countries for 10 year period. Overall, it is clear that France was the highest figure of tourist visitors.Howver, Japan also showed an upward trend.By contrast, USA started with the highest point and then declined over the period. Looking at the first figure, France […]

The chart below shows the average cost of monthly contract for four different mobile (cell phones) in a European country from January to September 2002

The line graph shows the average cost of monthly contract for four varieties of mobile devices in a Europian country from January to September 2002. Overall, it is clear that Demo and Lex slightly decreased in one of the period. While Sim TX increased marginally until Jun after that rose sharply. Demo and Lex rose […]

The chart below shows the changes that took place in three different areas of crime in New Port city center from 2003-2012. Summarise the information by selecting and reporting the main features, and make comparisons where relevant.

The line graph compares three different types of crime in terms of a number of incidents in the center of Newport city between 2003 and 2012. It is clear that the number of robbery incidents was by far the lowest figure during the research period. Additionally, the figure for burglaries experienced the most dramatic change […]

The chart below shows the changes that took place in three different areas of crime in New Port city center from 2003-2012. Summarise the information by selecting and reporting the main features, and make comparisons where relevant.

The line graph illustrates the fluctuation of crime rates in three various types in Newport city over the period of 9 years, from 2003 to 2012. Overall, all kinds of crime experienced frequent changes over 9 years with different levels. While the rates of car theft and robbery fluctuated slightly during the 9-year period, the […]

See All
We have detected unusual activity on your device.
Please verify your identity to continue.
Note: This verification step won't sign you in. If you have a premium account, please log in to access the service as usual.
Google/Gmail Verification
Or verify using Email/Code
We've sent a verification code to:
youremail@gmail.com (Not your email?)
Enter it below to complete the verification process.
Ensure your email address is correct, your inbox is not full, and you check your spam folder. If no email arrives, consider using an alternative email.
You will need a Premium plan to perform your action!
Note: If you already have a premium account, please log in to access our services as usual.

Plans & Pricing

Our mission is to make quality education accessible for everyone.
However, to keep our hardworking team running and this service alive, we genuinely need your support!
By opting for a premium plan, not only do you sustain us in achieving the mission, but you also unlock advanced features to enrich your learning experience.

Free

For learners who aren't pressed for time

What's included on Free
100+ Cambridge IELTS Tests
Instant IELTS Writing Task 1 & 2 Evaluation (2 times/month)
Instant IELTS Speaking Part 1, 2, & 3 Evaluation (2 times/month)
Instant IELTS Writing Task 1 & 2 Essay Generator (2 times/month)
500+ Dictation & Shadowing Exercises
100+ Pronunciation Exercises
Flashcards
Other Advanced Tools

Premium

For those serious about advancing their English proficiency, and for IELTS candidates aspiring to boost their band score by 1-2 points (especially in writing & speaking) in just 30 days or less

What's included on Premium
Save Your IELTS Test Progress & Analyze Mistakes By Question Type
Save Your Own Flashcard Sets & Use Them On Any Device
Unlock All Courses, IELTS Tests, Section & Part Practice
Unlimited AI Conversations
Unlimited AI Writing Enhancement Exercises
Unlimited IELTS Writing Task 1 & 2 Evaluation
Unlimited IELTS Speaking Part 1, 2, & 3 Evaluation
Checked Answers Will Not Be Published
Unlimited IELTS Writing Task 1 & 2 Essay Generator
Unlimited IELTS Speaking Part 1, 2, & 3 Sample Generator
Unlimited Usage Of Advanced Tools & AI Features
Priority Support within 24h (12-month plan only)

Due to the nature of our service and the provided free trials, payments are non-refundable.
Buy activation codes in bulk and give one to each learner. A code does not expire until it is used, and each subscription only starts counting once its code is entered, so you can buy now and hand them out later.

10+ codes: 10% off 25+ codes: 15% off 50+ codes: 20% off
The codes are emailed to your payment address as soon as the payment goes through, and are also shown on the confirmation page. A tax invoice is issued automatically at checkout — select Purchasing as a business there to put your organization's name and tax ID on it.
Nếu bạn là người Việt Nam và không có hoặc không muốn trả bằng credit/debit cards, bạn có thể thanh toán bằng phương thức chuyển khoản:


Chọn gói:
419,000₫ 277,000 ₫ cho gói 1 tháng (chỉ 9,233₫/ngày)
1,239,000₫ 597,000 ₫ cho gói 3 tháng (chỉ 6,633₫/ngày)
2,469,000₫ 1,027,000 ₫ cho gói 6 tháng (chỉ 5,706₫/ngày)
4,929,000₫ 1,417,000 ₫ cho gói 12 tháng (chỉ 3,936₫/ngày)


Sau khi chuyển khoản, vui lòng đợi trình duyệt tự động điều hướng bạn trở lại Engnovate và bạn sẽ ngay lập tức nhận được mã kích hoạt tài khoản premium.
Nếu có lỗi xảy ra, bạn có thể liên hệ với team thông qua một trong các phương thức: email đến helloengnovate@gmail.com hoặc nhắn tin qua facebook.com/engnovate.
Vì toàn bộ công cụ trên website đều có thể sử dụng thử miễn phí, Engnovate không hỗ trợ hoàn tiền.