Our system will evaluate the answer based on this AI-generated description.
The image depicts a bar graph representing the contribution of selected sectors to the UK economy in the twentieth century, with data points in 1900, 1950, 1975, and 2000. The graph shows three sectors: Agriculture (in blue), Manufacturing (in green), and Business and Financial (in purple). In 1900, Agriculture contributed approximately 10%, Manufacturing 50%, and Business and Financial 40%. In 1950, the contributions were approximately 5% for Agriculture, 45% for Manufacturing, and 50% for Business and Financial. By 1975, Agriculture's contribution decreased to around 2%, while Manufacturing and Business and Financial had contributions of roughly 35% and 63% respectively. In 2000, Agriculture's contribution was negligible at less than 5%, Manufacturing decreased further to around 25%, and Business and Financial increased to around 70%.
Given the complexity of the image, the above description may not be entirely accurate.
Skyrocket your IELTS band score by 1-2 points in under a month with our premium plan!
Note: Both the topic and the answer were created by one of our users.
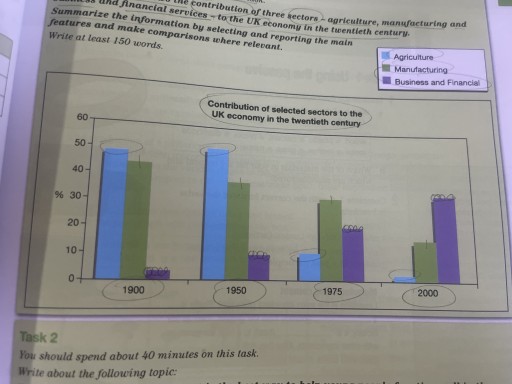
The bar chart illustrates how agriculture, manufacturing, and business and financial services contributed to the UK economy during the twentieth century.
It is clear that, in initial stage the proportion of agriculture was higher than that of the other sectors. The percentage of manufacturing decreased gradually over the century, contrast to the dramatic decline in farming.
The percentage of agriculture in the UK economy significantly decreased over the twentieth century. In 1900, it accounted for roughly 49%, but by 2000, this had dropped to 2%. In contrast, despite manufacturing contributed 45% in the initial year, there was a threefold decrease in the proportion of this sector over the century.
Meanwhile, business and financial services experienced steady growth, becoming the largest sector by the end of the century. In 1900, the proportion of this sector was the smallest, at 3%. By 2000, this figure had increased to about 35%. This growth was driven by technological progress and the shift to a service-based economy.
Word Count: 162