Our system will evaluate the answer based on this AI-generated description.
The image presents a bar chart displaying the number of US households in millions, segmented by annual income for the years 2007, 2011, and 2015. Five income brackets are represented: Less than $25,000; $25,000-$49,999; $50,000-$74,999; $75,000-$99,999; $100,000 or more. In 2007, households earning less than $25,000 numbered 25 million, $25,000-$49,999 had 30 million, $50,000-$74,999 with 20 million, $75,000-$99,999 captured 15 million, and $100,000 or more included 10 million households. In 2011, numbers slightly decreased for the first three brackets to 23, 28, and 18 million respectively, while the last two brackets increased to 17 and 12 million respectively. By 2015, the less than $25,000 bracket further decreased to 20 million, $25,000-$49,999 reduced to 25 million, $50,000-$74,999 remained at 18 million, $75,000-$99,999 increased to 20 million, and $100,000 or more saw significant growth to 25 million households.
Given the complexity of the image, the above description may not be entirely accurate.
Skyrocket your IELTS band score by 1-2 points in under a month with our premium plan!
Note: Both the topic and the answer were created by one of our users.
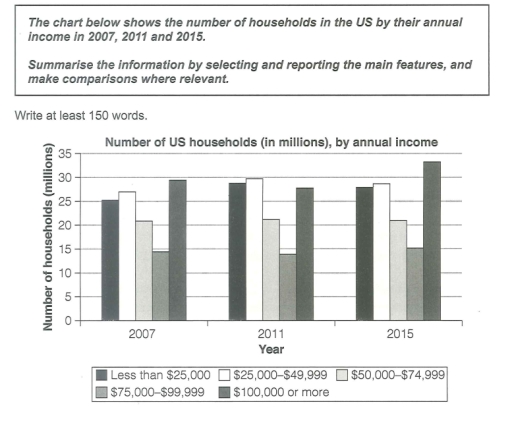
The data displays the amount of American residences by their annual revenue in 3 different years.
Overall, 5 categories of income tend to be fluctuative, except for families between 50k – 74,9k USD which is remain steady.
Firstly, some different level of incomes have a same pattern year per year. By the end of the observed period, households with 75k and 100k USD income per year become more in number. Almost 10 million people gain the highest revenue in 2015 . On the other hand, families that less than 25k and 50k USD per year have a slight increasement from 2007 to 2011 before it goes down again in 2015 , there is 5 million people in total of this two categories who lose their financial abilities.
Secondly, 50k to 74,9k revenue residences did not changed at all, it is normally stay in the same number of up to 20 million. Lastly, the 75k to 99,9k USD homes annual income stay at the lowest among all year.
Word Count: 167