🔥 Today Only: Save 30% on Premium — Offer Ends Soon! - Upgrade Now!
Bar Chart

Band 5+: The chart shows the number of households in US by their annual income in 2007,2011 and 2015

Image for topic: The chart shows the number of households in US by their annual income in 2007,2011 and 2015
Our system will evaluate the answer based on this AI-generated description.
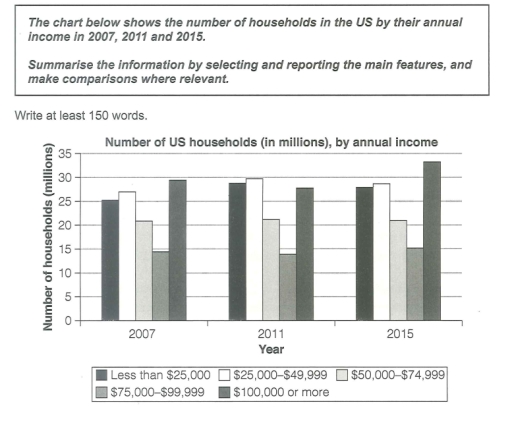
The image presents a bar chart displaying the number of US households in millions, segmented by annual income for the years 2007, 2011, and 2015. Five income brackets are represented: Less than $25,000; $25,000-$49,999; $50,000-$74,999; $75,000-$99,999; $100,000 or more. In 2007, households earning less than $25,000 numbered 25 million, $25,000-$49,999 had 30 million, $50,000-$74,999 with 20 million, $75,000-$99,999 captured 15 million, and $100,000 or more included 10 million households. In 2011, numbers slightly decreased for the first three brackets to 23, 28, and 18 million respectively, while the last two brackets increased to 17 and 12 million respectively. By 2015, the less than $25,000 bracket further decreased to 20 million, $25,000-$49,999 reduced to 25 million, $50,000-$74,999 remained at 18 million, $75,000-$99,999 increased to 20 million, and $100,000 or more saw significant growth to 25 million households.
Given the complexity of the image, the above description may not be entirely accurate.
Note: Both the topic and the answer were created by one of our users.

The bar chart presents information about the number of household in the US by their annual income in three different years 2007,2011 and 2015.

It compares the overall number of households in millions and their annual income divided into 5 different income categories, throughout the period of 8 years.

The most noticeable change concern the growth of household from a category with income of 100,000 thousand or more which constituted approximately 30 million in 2007, slightly dropped to little above 25 million in 2011 and increased in 2015 to almost 35 million. A similar trend can be observed within a category of household with an income from 25,000 to 49,999 thousand which rose from about 27 million in 2007 to almost 30 million in 2011, to shrink about 1-2% in 2015.

According to the chart households with annual income of 50,000 to 74,999 and 75,000 to 99,999 both stood steadily the whole period. Approximately 20 milion, and little less than 15 milion, respectively. In comparison to households with less than 25,000 of income that firstly rose from 25 milion in 2007 to almost 30 milion in 2011, surprisingly to drop more or less 5% in 2015.

Word Count: 196

Answers On The Same Topic:

The chart shows the number of households in US by their annual income in 2007,2011 and 2015

The bar chart examines the number of households in the USA based on their yearly income for the years 2007, 2011, and 2015. Overall, the chart shows that families earning around $100,000 consistently dominated during these periods, except in 2011 when the number of households with incomes between $25,000 and $49,999 was at its peak. […]

The chart shows the number of households in US by their annual income in 2007,2011 and 2015

The bar chart examines the number of households in the USA in terms of their yearly income in three years, 2007, 2011 and 2015. Overall, what stands out on the chart is that families earning around a hundred thousand dollars dominated all the periods, with the exception of 2011 when the number of households with […]

The chart shows the number of households in US by their annual income in 2007,2011 and 2015

The bar graph delineates the information regarding the amount of residents in America by their yearly earnings in 2007, 2011 and 2015. The data has been calibrated in millions. As a general overview, it is crystal clear that the maximum income has been generated in the third year. On having a meticulous glance of the […]

The chart shows the number of households in US by their annual income in 2007,2011 and 2015

The bar chart presents the number of American households according to their annual revenue in three different years. Overall, while the number of people who earned less than 25,000, more than 25,000, and over 100,000 increased, the figures for those who earned between 50,000 and 100,000 stayed relatively stable over the 8-year period. In detail, […]

The chart shows the number of households in US by their annual income in 2007,2011 and 2015

The bar chart delineates the distribution of households in the United States classified by their annual income across the years 2007, 2011, and 2015. Overall, the data reveals notable fluctuations in household numbers across various income brackets, with those in the highest income categories experiencing significant growth over the observed period. In 2007, the income […]

See All

Other Topics:

The chart below gives information about the UK's ageing population in 1985 and makes predictions for 2035. Summarize the information by selecting and reporting the main features, and make comparisons where relevant.

The bar chart provides the information about UK’s ageing populace in the year of 1985 and makes prognostication for 2035. Overall, it is clear that the percentage of elderly population is expected to increase across all region by 2035. Wales expected to increase population as compared to other four regions. In 1985, Wales had the […]

The chart below shows the number of people employed in five types of work on one region of Australia in 2001 and 2008. Summarise the information by selecting and reporting the main features, and make comparisons where relevant.

The bar chart illustrates the numbers of employees in five types of works on one region of Australia between 2001 and 2008. Overall, it is clear that sales sector accounted for the majority of employees while farming took up the smallest share. In addition, while sales, computing and nursing experienced growth, accounting and farming witnessed […]

The charts below show the price of fuel in two states of the USA from 2005 to 2009.

The bar charts compare the cost of gasoline and petrol, measured in dollars per litre, in two different states of the USA between 2005 to 2009. Overall, both types of fuel experienced an increase until 2008, before ending up falling down in 2009. Additionally, citizens had to pay more money to buy gasoline than petrol […]

The graph compares the percentage of International and the percentage of UK students gaining second class degrees or better at a major UK university.

The graph illustrates the comparison of International and UK students improving in different major in university in 2009.The result of the survey will be showing in percentage form. Firsty,In subject of Information technology and Electrical engineering can clearly see that International students both reached high rates of 80 percent gaining more effective than UK students […]

The bar chart shows the treatment of waste in different countries.

The provided data illustrate how waste is treated in various countries. Overall, landfills make up a large portion of the graph, with three countries relying on that as the main method of disposing waste. Whereas being used as chemicals is shown to be consistently low among all four countries. According to the chart, Netherlands is […]

The bar charts below show the prevalence of obesity among boys and girls aged 12 to 19 years by ethnicity, in the United States for the years 2004 and 2014.

The bar charts compare the percentage of obese boys and girls aged 12 to 19 across three ethnic groups in the US in two different years: 2004 and 2014. Overall, obesity rates increased across all ethnic groups for both genders over the ten-year period. In addition, Hispanic boys and Non-Hispanic Black girls experienced the highest […]

See All
We have detected unusual activity on your device.
Please verify your identity to continue.
Note: This verification step won't sign you in. If you have a premium account, please log in to access the service as usual.
Google/Gmail Verification
Or verify using Email/Code
We've sent a verification code to:
youremail@gmail.com (Not your email?)
Enter it below to complete the verification process.
Ensure your email address is correct, your inbox is not full, and you check your spam folder. If no email arrives, consider using an alternative email.
You will need a Premium plan to perform your action!
Note: If you already have a premium account, please log in to access our services as usual.

Plans & Pricing

Our mission is to make quality education accessible for everyone.
However, to keep our hardworking team running and this service alive, we genuinely need your support!
By opting for a premium plan, not only do you sustain us in achieving the mission, but you also unlock advanced features to enrich your learning experience.

Free

For learners who aren't pressed for time

What's included on Free
100+ Cambridge IELTS Tests
Instant IELTS Writing Task 1 & 2 Evaluation (2 times/month)
Instant IELTS Speaking Part 1, 2, & 3 Evaluation (2 times/month)
Instant IELTS Writing Task 1 & 2 Essay Generator (2 times/month)
500+ Dictation & Shadowing Exercises
100+ Pronunciation Exercises
Flashcards
Other Advanced Tools

Premium

For those serious about advancing their English proficiency, and for IELTS candidates aspiring to boost their band score by 1-2 points (especially in writing & speaking) in just 30 days or less

What's included on Premium
Save Your IELTS Test Progress & Analyze Mistakes By Question Type
Save Your Own Flashcard Sets & Use Them On Any Device
Unlock All Courses, IELTS Tests, Section & Part Practice
Unlimited AI Conversations
Unlimited AI Writing Enhancement Exercises
Unlimited IELTS Writing Task 1 & 2 Evaluation
Unlimited IELTS Speaking Part 1, 2, & 3 Evaluation
Checked Answers Will Not Be Published
Unlimited IELTS Writing Task 1 & 2 Essay Generator
Unlimited IELTS Speaking Part 1, 2, & 3 Sample Generator
Unlimited Usage Of Advanced Tools & AI Features
Priority Support within 24h (12-month plan only)

Due to the nature of our service and the provided free trials, payments are non-refundable.