Our system will evaluate the answer based on this AI-generated description.
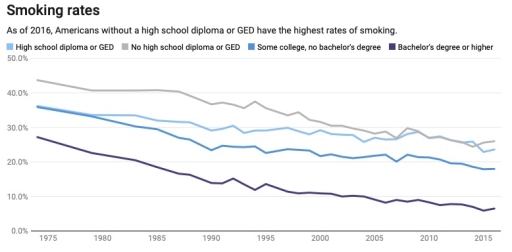
The image shows smoking rates from 1975 to 2015 among different education levels, with high school diploma or GED rates starting around 37.5% in 1975, decreasing to approximately 35% in 1980, around 32% in 1985, 30% by 1990, 29% by 1995, 25% by 2000, 24% in 2005, 20% by 2010, and slightly above 20% by 2015; no high school diploma or GED rates start at 50% in 1975, dropping to about 43% by 1980, around 40% by 1985, approximately 38% in 1990, roughly 35% in 1995, 32% by 2000, 31% in 2005, 28% by 2010, and slightly above 27% by 2015; some college, no bachelor's degree rates begin near 37.5% in 1975, decrease to about 33% in 1980, approximately 30% in 1985, drop to roughly 28% in 1990, 25% in 1995, 22.5% in 2000, fall slightly above 20% in 2005, hover around 20% in 2010, and settle just above 18% by 2015; bachelor's degree or higher rates start close to 29% in 1975, decline steadily to 25% in 1980, reach 21% in 1985, around 19% in 1990, about 15% in 1995, slightly below 13% in 2000, slightly below 10% in 2005, and finally stabilize at approximately 9% by 2010 and 2015.
Given the complexity of the image, the above description may not be entirely accurate.
Skyrocket your IELTS band score by 1-2 points in under a month with our premium plan!
Note: Both the topic and the answer were created by one of our users.
The line gragh information about the Americans without a high scool diploma or GED have the highest rates of smoking around 1975 to 2015 years.
Overall, in this category compare four types of American high school diploma or GED second type is no high school diploma, third is so,e collage, no balchelor’s degree and four is barchelor’s degree or higher. in this chart the most increased no high school diploma but the most decreased bachelor’s degree or higher.
It is clear, begin with high school diploma or GED saw decrease of minimally by only 22.0%, after that this only fluctuated. Second is no high school diploma registered a significant decrease by only 38 percentage between 1975 to1990, then, only fluctuated too between 1990 to 2015.
In detail, third is some collage, no bachelor’s degree did not changed around 1975 and 1980,moreover, only oscillated between 1980 to 2015. And in Bachelor’s degree or higher a decrease minimally by only 12 of percentage between 1975 to 1990, next,it only fluctuated too around 1990 and 2015.
Word Count: 173
