🔥 Today Only: Save 30% on Premium — Offer Ends Soon! - Upgrade Now!
Table

Band 5+: he table shows the different flat sizes along with living space per person in 1980s, 1990s and 2000s. Summarise the information by selecting and reporting the main features, and make comparisons where relevant.

Image for topic: he table shows the different flat sizes along with living space per person in 1980s, 1990s and 2000s. Summarise the information by selecting and reporting the main features, and make comparisons where relevant.
Our system will evaluate the answer based on this AI-generated description.
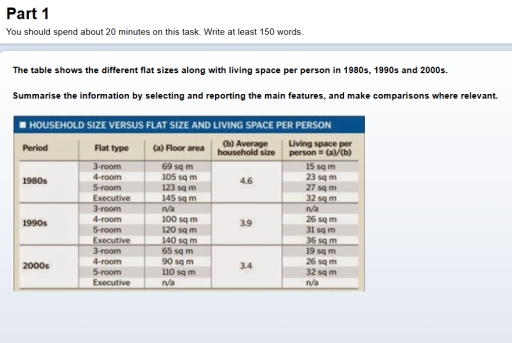
The image displays a table detailing household size versus flat size and living space per person across the 1980s, 1990s, and 2000s. In the 1980s, 3-room flats are 60 sq m, 4-room 90 sq m, 5-room 120 sq m, and Executive 145 sq m, with average household size at 4.6; living space per person recorded is 13 sq m for 3-room, 20 sq m for 4-room, 26 sq m for 5-room, and 32 sq m for Executive. In the 1990s, 3-room flats are 70 sq m, 4-room 100 sq m, 5-room 130 sq m, and Executive 150 sq m, with average household size at 3.7; living space per person is 19 sq m for 3-room, 27 sq m for 4-room, 35 sq m for 5-room, and 41 sq m for Executive. In the 2000s, 3-room flats are 90 sq m, 4-room 110 sq m, 5-room 140 sq m, and no data for Executive, with average household size at 3.4; living space per person is 26 sq m for 3-room, 32 sq m for 4-room, and 41 sq m for 5-room.
Given the complexity of the image, the above description may not be entirely accurate.
Note: Both the topic and the answer were created by one of our users.

The table chart (table) depicts various types of flat sizes with living space per person in three different decades (the 1980s, 1990s, and 2000s). It gives information about the floor area, average household size, and living space per person.

Overall, the average household size has decreased (decreased) along the years (over the years). Some type (types) of flats were not available in some years.

To begin with, In (in) the 1980s, the average household size was 4.6, leading to limited living space per person, whereas 15 sq m (there were 15 sq m) in 3-room flats and 32 sq m in executive flats. In the 1990 (1990s), the household size dropped to 3.9. Moreover, some flat sizes were slightly smaller, with 4-room flatswith (4-room flats with) 26 sq m and executive flats providing up to 36 sq m per person.

In addition, In (in) the 2000s, the average household size declined to 3.4. Despite reductions in floor area for certain flat types, such as 4-room flats shrinking to 90 sq m, the living space per person remained the same. The 5-room flats offered 32 sq m per person.

Word Count: 188

Answers On The Same Topic:

he table shows the different flat sizes along with living space per person in 1980s, 1990s and 2000s. Summarise the information by selecting and reporting the main features, and make comparisons where relevant.

The table illustrates the space required by one individual to live and the several appratment dimentions from 1980 to 2000. The figures are shown in meter squares. Overall, the highest household mean size was in the start of the period whereas, the smallest living area was in the lowest room flat type in the same […]

he table shows the different flat sizes along with living space per person in 1980s, 1990s and 2000s. Summarise the information by selecting and reporting the main features, and make comparisons where relevant.

The picture compares the apartment size and living place for each person between 1980 and 2000. Overall, it is easy to notice that by 2000, floor area and average household size are decreased, while living space per person is slightly increased. In 1980, average household size accounted for 4.6 in overall. For every flat type […]

he table shows the different flat sizes along with living space per person in 1980s, 1990s and 2000s. Summarise the information by selecting and reporting the main features, and make comparisons where relevant.

This table demonstrates the various household sizes along with living space per individual in 1980s, 1990s and 2000s. This essay will illustrates flat types, floor areas, the average house sizes and living space per person in periods during 1980s to 2000s. Overall, the household size had been happened a large of changing, espically, sectors such […]

he table shows the different flat sizes along with living space per person in 1980s, 1990s and 2000s. Summarise the information by selecting and reporting the main features, and make comparisons where relevant.

The table illustrates the floor area of various flat types, their average household size, and the living space available per person in Singapore during the 1980s, 1990s, and 2000s. Overall, while the size of flats generally increased over the decades, the average living space per individual gradually decreased. This trend is mainly attributed to the […]

See All

Other Topics:

the table below gives information about the changes in the military budgets of 8 countries between 2004 and 2020

The table shows how much money were in military budgets in eight different countries in 2004 and 2020. In general, almost all country budgets trended upwards, the only nations which bucked down were the United Kingdom and Italy. It is worth mentioning that, the United States stood out with the highest amount of money while […]

The table shows the number of international students from five different countries who enrolled in a university in the UK in 2018 and 2022.

The table provides information about the number of students from five countries who enrolled at a UK university in 2018 and 2022 Overall,the number of students from most countries increased in 2022 compared with 2018.The biggest number of international students came from China in both years,while the number of students from Brazil was the lowest. […]

The table below shows the percentage of people in four age groups who used three types of social media in a country in 2010 and 2025.

The table illustrates the percentage of people in four different age groups who used three types of social media in a certain country over a 15-year period. Overall, people aged 18-24 recorded the highest proportion of social networking users in 2025, while people aged 50 and over showed the slowest percentage of professional networking in […]

The table below presents the food consumption per weekly in aEuropean country in 1992, 2002 and 2012.

The table illustrates the weekly consumption of five types of food, namely vegetables, meat, wheat, beans and cheese, per person in a European country in 1992, 2002 and 2012. Overall, vegetables were by far the most widely consumed food throughout the period, whereas cheese had the lowest figures. The consumption of vegetables, wheat and beans […]

The table below shows the consumption of three basic foods (wheat, maize, rice) by people in four different countries.

The table compares the consumption of three basic foods, which are wheat, maize and rice, by people, measured in calories per person per day, in four different countries. Overall, it is clear that the highest consumption of wheat was recorded at both Poland and Egypt. However, in Cambodia the consumption of rice was the dominant […]

The table shows questionnaires about the opinions of club members and general public for the new theater in one town in 2012.

The table shows opinions about new theater questioned by club members and general public in 2012. Overall, club members gave more positive ratings for facilities and quality, whereas the general public rated information more favourably. Quality recieved the lowest proportion of poor ratings, while information had the highest figure of people who choosed it to […]

See All
We have detected unusual activity on your device.
Please verify your identity to continue.
Note: This verification step won't sign you in. If you have a premium account, please log in to access the service as usual.
Google/Gmail Verification
Or verify using Email/Code
We've sent a verification code to:
youremail@gmail.com (Not your email?)
Enter it below to complete the verification process.
Ensure your email address is correct, your inbox is not full, and you check your spam folder. If no email arrives, consider using an alternative email.
You will need a Premium plan to perform your action!
Note: If you already have a premium account, please log in to access our services as usual.

Plans & Pricing

Our mission is to make quality education accessible for everyone.
However, to keep our hardworking team running and this service alive, we genuinely need your support!
By opting for a premium plan, not only do you sustain us in achieving the mission, but you also unlock advanced features to enrich your learning experience.

Free

For learners who aren't pressed for time

What's included on Free
100+ Cambridge IELTS Tests
Instant IELTS Writing Task 1 & 2 Evaluation (2 times/month)
Instant IELTS Speaking Part 1, 2, & 3 Evaluation (2 times/month)
Instant IELTS Writing Task 1 & 2 Essay Generator (2 times/month)
500+ Dictation & Shadowing Exercises
100+ Pronunciation Exercises
Flashcards
Other Advanced Tools

Premium

For those serious about advancing their English proficiency, and for IELTS candidates aspiring to boost their band score by 1-2 points (especially in writing & speaking) in just 30 days or less

What's included on Premium
Save Your IELTS Test Progress & Analyze Mistakes By Question Type
Save Your Own Flashcard Sets & Use Them On Any Device
Unlock All Courses, IELTS Tests, Section & Part Practice
Unlimited AI Conversations
Unlimited AI Writing Enhancement Exercises
Unlimited IELTS Writing Task 1 & 2 Evaluation
Unlimited IELTS Speaking Part 1, 2, & 3 Evaluation
Checked Answers Will Not Be Published
Unlimited IELTS Writing Task 1 & 2 Essay Generator
Unlimited IELTS Speaking Part 1, 2, & 3 Sample Generator
Unlimited Usage Of Advanced Tools & AI Features
Priority Support within 24h (12-month plan only)

Due to the nature of our service and the provided free trials, payments are non-refundable.