🔥 Today Only: Save 30% on Premium — Offer Ends Soon! - Upgrade Now!
Table

Band 4+: he table shows the different flat sizes along with living space per person in 1980s, 1990s and 2000s. Summarise the information by selecting and reporting the main features, and make comparisons where relevant.

Image for topic: he table shows the different flat sizes along with living space per person in 1980s, 1990s and 2000s. Summarise the information by selecting and reporting the main features, and make comparisons where relevant.
Our system will evaluate the answer based on this AI-generated description.
The image displays a table detailing household size versus flat size and living space per person across the 1980s, 1990s, and 2000s. In the 1980s, 3-room flats are 60 sq m, 4-room 90 sq m, 5-room 120 sq m, and Executive 145 sq m, with average household size at 4.6; living space per person recorded is 13 sq m for 3-room, 20 sq m for 4-room, 26 sq m for 5-room, and 32 sq m for Executive. In the 1990s, 3-room flats are 70 sq m, 4-room 100 sq m, 5-room 130 sq m, and Executive 150 sq m, with average household size at 3.7; living space per person is 19 sq m for 3-room, 27 sq m for 4-room, 35 sq m for 5-room, and 41 sq m for Executive. In the 2000s, 3-room flats are 90 sq m, 4-room 110 sq m, 5-room 140 sq m, and no data for Executive, with average household size at 3.4; living space per person is 26 sq m for 3-room, 32 sq m for 4-room, and 41 sq m for 5-room.
Given the complexity of the image, the above description may not be entirely accurate.
Note: Both the topic and the answer were created by one of our users.

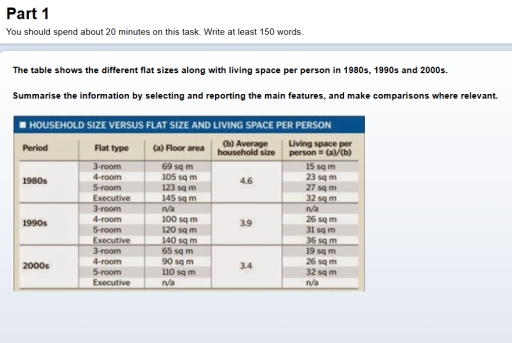
This table demonstrates the various household sizes along with living space per individual in 1980s, 1990s and 2000s. This essay will illustrates flat types, floor areas, the average house sizes and living space per person in periods during 1980s to 2000s.

Overall, the household size had been happened a large of changing, espically, sectors such as the average flat size and floor areas. Additionally, flat types and living room per individual had not been enhanced.

First of all, floor areas had eliminated espically, the 5-room during 2000s, but in 1980s and 1990s were the same size such as 123, 120 and 110 sq m. Linking with the average flat size has been declained since 4.6 to 3.4. This sector had not been increased.

Secondly, the living space per person had been remained the same level such as 15 sq m to 32 sq m on all flat types. However, the 3-room has been a fluctuation in 1990s.

Word Count: 157

Answers On The Same Topic:

he table shows the different flat sizes along with living space per person in 1980s, 1990s and 2000s. Summarise the information by selecting and reporting the main features, and make comparisons where relevant.

The picture compares the apartment size and living place for each person between 1980 and 2000. Overall, it is easy to notice that by 2000, floor area and average household size are decreased, while living space per person is slightly increased. In 1980, average household size accounted for 4.6 in overall. For every flat type […]

he table shows the different flat sizes along with living space per person in 1980s, 1990s and 2000s. Summarise the information by selecting and reporting the main features, and make comparisons where relevant.

The table illustrates the floor area of various flat types, their average household size, and the living space available per person in Singapore during the 1980s, 1990s, and 2000s. Overall, while the size of flats generally increased over the decades, the average living space per individual gradually decreased. This trend is mainly attributed to the […]

he table shows the different flat sizes along with living space per person in 1980s, 1990s and 2000s. Summarise the information by selecting and reporting the main features, and make comparisons where relevant.

The given table depicts the various smooth sizes along with residing area per person in 1980s, 1990s, and 2000s. Overall, floor areas saw slight changes, the average houshold size steadily decreased, resulting in increased living space per person over period. In 1980s, the average houshold size was 4.6, leading to limited living space person such […]

he table shows the different flat sizes along with living space per person in 1980s, 1990s and 2000s. Summarise the information by selecting and reporting the main features, and make comparisons where relevant.

The table presents data on flat sizes and living space per person in the 1980s, 1990s, and 2000s. Overall, while floor areas saw slight changes, the average household size steadily decreased, resulting in increased living space per person over time. In the 1980s, the average household size was 4.6, leading to limited living space per […]

See All

Other Topics:

The table below shows water use for different purposes in four countries. The use of water by four different countries (%) Country Domestic use Industry Agriculture Egypt 8 10 82 Saudi Arabia 6 30 64 New Zealand 10 46 44 Canada 20 70 10

UThe table below shows water use for different purposes in four countries. The table illustrates information about the consumption of water for various purposes in four countries such as Egypt, Saudi Arabia, New Zealand and Canada. Overall, it is also clear that In Domestic use has many low consumptions in each nations. Whereas Industry and […]

The table shows the position of women in governmnets and management in 2000 in 5 countries

The statistical board compares the proportions of women holding seats and managing positions in five different countries in 2000. Overall, women were more strongly respresented in management than in parliament in every country. Norway had the highest proportion of female parliamentarians, while Italy recorded the largest share of women in management despite having one of […]

the table below shows the persentage of household spending on five different categories in three countries in 2010

The picture provides information about the percentage of household spending in different three countries in 2010. Overall, the data is presented several spending categories: food, housing, transportation, education, and entertainment. The picture is shown that every country accounted for the different percentage on five types of spending. On the one hand, the highest food spending, […]

The table shows the amount of money given to developing countries by the USA,EU countries and other countries from 2006 to 2010(figures are in millions of dollars)

The table show the amount of money which was given to developing countries by the USA, EU countries and other countries from 2006 to 2010, in millions of dollars. Overall, USA gave the biggest amount of money in all years. Also, the total number mostly increased during the period, but in 2009 it decreased a […]

The table below shows the number of people working different jobs in one country in 2015 and 2025, and its projected changes

The supplied tabular data depicts the number of individuals working distinct positions in one specific country from 2015 to 2025, along with the projected percentage changes over the period. From an overall perspective, it is evident that all occupations are expected to experience growth expect cleaners, whose employment figures are projected to declined slightly. Professors […]

The table shows percentage of students giving good ratings for different aspects of a university in China in 2000, 2005, 2010.

This table chart compares percentage of student giving rating in several aspect at unversity in china between 2000 and 20010. Based on the chart, in 2000, 63% of students give good ratings at technical quality and remain the same for 5 years, and it increased to 69% of students rating by 2010. Following that, print […]

See All
We have detected unusual activity on your device.
Please verify your identity to continue.
Note: This verification step won't sign you in. If you have a premium account, please log in to access the service as usual.
Google/Gmail Verification
Or verify using Email/Code
We've sent a verification code to:
youremail@gmail.com (Not your email?)
Enter it below to complete the verification process.
Ensure your email address is correct, your inbox is not full, and you check your spam folder. If no email arrives, consider using an alternative email.
You will need a Premium plan to perform your action!
Note: If you already have a premium account, please log in to access our services as usual.

Plans & Pricing

Our mission is to make quality education accessible for everyone.
However, to keep our hardworking team running and this service alive, we genuinely need your support!
By opting for a premium plan, not only do you sustain us in achieving the mission, but you also unlock advanced features to enrich your learning experience.

Free

For learners who aren't pressed for time

What's included on Free
100+ Cambridge IELTS Tests
Instant IELTS Writing Task 1 & 2 Evaluation (2 times/month)
Instant IELTS Speaking Part 1, 2, & 3 Evaluation (5 times/month)
Instant IELTS Writing Task 1 & 2 Essay Generator (2 times/month)
500+ Dictation & Shadowing Exercises
100+ Pronunciation Exercises
Flashcards
Other Advanced Tools

Premium

For those serious about advancing their English proficiency, and for IELTS candidates aspiring to boost their band score by 1-2 points (especially in writing & speaking) in just 30 days or less

What's included on Premium
Save Your IELTS Test Progress
Unlock All Courses & IELTS Tests
Unlimited AI Conversations
Unlimited AI Writing Enhancement Exercises
Unlimited IELTS Writing Task 1 & 2 Evaluation
Unlimited IELTS Speaking Part 1, 2, & 3 Evaluation
Checked Answers Will Not Be Published
Unlimited IELTS Writing Task 1 & 2 Essay Generator
Unlimited IELTS Speaking Part 1, 2, & 3 Sample Generator
Unlimited Usage Of Advanced Tools
Priority Support within 24h (12-month plan only)

Due to the nature of our service and the provided free trials, payments are non-refundable.
Nếu bạn là người Việt Nam và không có hoặc không muốn trả bằng credit/debit cards, bạn có thể thanh toán bằng phương thức chuyển khoản:


Chọn gói:
419,000₫ 277,000 ₫ cho gói 1 tháng (chỉ 9,233₫/ngày)
1,239,000₫ 597,000 ₫ cho gói 3 tháng (chỉ 6,633₫/ngày)
2,469,000₫ 1,027,000 ₫ cho gói 6 tháng (chỉ 5,706₫/ngày)
4,929,000₫ 1,417,000 ₫ cho gói 12 tháng (chỉ 3,936₫/ngày)


Sau khi chuyển khoản, vui lòng đợi trình duyệt tự động điều hướng bạn trở lại Engnovate và bạn sẽ ngay lập tức nhận được mã kích hoạt tài khoản premium.
Nếu có lỗi xảy ra, bạn có thể liên hệ với team thông qua một trong các phương thức: email đến helloengnovate@gmail.com hoặc nhắn tin qua facebook.com/engnovate.
Vì toàn bộ công cụ trên website đều có thể sử dụng thử miễn phí, Engnovate không hỗ trợ hoàn tiền.