🔥 Today Only: Save 30% on Premium — Offer Ends Soon! - Upgrade Now!
Multiple Graphs

Band 6+: Task 1 - The bar chart below shows the estimated sales of jeans for two companies next year in Turkey. The pie chart shows the projected market share of the two companies in jeans at the end of search next year.

Image for topic: Task 1 - The bar chart below shows the estimated sales of jeans for two companies next year in Turkey. The pie chart shows the projected market share of the two companies in jeans at the end of search next year.
Our system will evaluate the answer based on this AI-generated description.
The image shows a bar chart comparing monthly sales in thousands of pairs for Mango Co. and Jack & Jones Co. from January to December, with Mango Co. consistently selling fewer pairs: Jan (Mango Co. ~100, Jack & Jones Co. ~200), Feb (Mango Co. ~150, Jack & Jones Co. ~300), Mar (Mango Co. ~200, Jack & Jones Co. ~400), Apr (Mango Co. ~250, Jack & Jones Co. ~500), May (Mango Co. ~300, Jack & Jones Co. ~550), June (Mango Co. ~300, Jack & Jones Co. ~600), July (Mango Co. ~350, Jack & Jones Co. ~650), Aug (Mango Co. ~350, Jack & Jones Co. ~700), Sept (Mango Co. ~400, Jack & Jones Co. ~750), Oct (Mango Co. ~450, Jack & Jones Co. ~800), Nov (Mango Co. ~500, Jack & Jones Co. ~850), Dec (Mango Co. ~550, Jack & Jones Co. ~950). A pie chart displays the projected market share with Mango Co. at 30%, Jack & Jones Co. at 50%, and Others at 20%.
Given the complexity of the image, the above description may not be entirely accurate.
Note: Both the topic and the answer were created by one of our users.

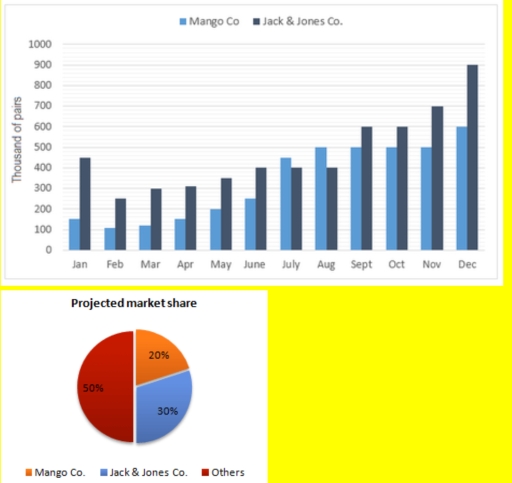
Two figures concerning sales in Turkey are given. The first provides data about sales of pairs of jeans, while the second illustrates the proportion share of the jeans market.

Overall, there are two leading companies which make a big percentage of jeans products in Turkey. Jack Jones Co and Mango Co seilings significantly rose over the period.

At the beginning of the bar charts Jack Jones transfer was the highest one , while Mango had a ⅓ from Jack & Jones . Having gone down in February, both of these markets demonstrated steady rises until the end of the chart. Additionally, in July Jack & Jones and Mango Co had similar results with 400000 and over 400000, respectively. From June to August Jack & Jones sellings remained stable, and Mango also leveled off between August and November. In December Jack & Jones reached its maximum value, peaking at 900 thousand pairs. In addition, December saw 600,000 sold pairs of jeans from Mango co, resulting in an increase in sales by more than 4 times compared to the starting point.

Word Count: 179

Answers On The Same Topic:

Task 1 – The bar chart below shows the estimated sales of jeans for two companies next year in Turkey. The pie chart shows the projected market share of the two companies in jeans at the end of search next year.

The bar chart illustrates sales of jeans for two turkish companies for the next year. And pie chart shows all rejected sale shares of these two companies in the end of the year. Overall both of the charts illustrates obvious dominate of sales of Jack & Jones Co. In the beginning of the year Jack […]

Task 1 – The bar chart below shows the estimated sales of jeans for two companies next year in Turkey. The pie chart shows the projected market share of the two companies in jeans at the end of search next year.

The diagrams depict the annual sales of jeans by Mango Co. and Jack & Jones Co. in Turkey next year, alongside the forecast distribution of market share among several brands by the end of that year. Overall, both companies are expected to achieve their highest sales figures in December, with Jack & Jones projected to […]

Task 1 – The bar chart below shows the estimated sales of jeans for two companies next year in Turkey. The pie chart shows the projected market share of the two companies in jeans at the end of search next year.

The illustration compares the expected shares for the next years of two companies that produce jeans in Turkey as well as assumed market share of these companies at the end of next year. Overall, Jack&Jones company will primarily dominate in both charts, gradually increasing its sales despite a sudden decrease in the beginning, while Mango […]

Task 1 – The bar chart below shows the estimated sales of jeans for two companies next year in Turkey. The pie chart shows the projected market share of the two companies in jeans at the end of search next year.

The bar graph illustrates how many jeans given two companies, namely Jack & Jones and Manngo companies, will sell in the following year, whereas the pie chart compares the projected market share about jeans sales in the next year. Overall, it is predicted that Jack & Jones company get more consumer in the most of […]

Task 1 – The bar chart below shows the estimated sales of jeans for two companies next year in Turkey. The pie chart shows the projected market share of the two companies in jeans at the end of search next year.

The bar chart illustrates the information on the sales of jeans prediction rate in two companies at the end the year in Thurkey,while the pie chart presents their estimation of market shares.Overall,the projection of sales in both ccompanies is to have a considerable increase throughout the 12 months,while jack and Jones company represents the highest […]

See All

Other Topics:

The first chart below shows the value of goods that australia imported from china and those exported to china from australia. The second chart shows the types of good imported from china. Summarise the information by selecting and reporting the main features, and make a comparisons where relevant.

The first vertical bar chart illustrate the value of Australia’s imports from and exports to China from 1998 to 2004. The second one gives information about the kinds of goods imported from China in 2003 and 2004. Looking from an overall perspective, it is readily apparent that the value of both imports and exports experienced […]

The first chart below shows the value of goods that australia imported from china and those exported to china from australia. The second chart shows the types of good imported from china. Summarise the information by selecting and reporting the main features, and make a comparisons where relevant.

The first chart illustrates the value of goods imported and exported from China to Australia from 1998 to 2004, while the second chart gives information of different types of goods imported from China from 2003 to 2004. Overall, the value of goods imported from China to Australia was higher than that of exported goods in […]

Part 1: The graph below shows the weekly working hours or men and women omen in in government institutions and private institutions.

The pie charts compare the proportions of workers, broken down by genders, in two sectors. Overall, in the government sector, a majority of workers, regardless of gender, were working 1-2, 6-12, 13-30, 31-45 hours, in contrast to the over 46 hours, where only a minority of women were recorded. As for the private sector, the […]

The charts below illustrate which of 3 fast-food restaurants were the most preferred amongst teenagers in Vietnam and Indonesia in 2017 and predictions for 2027.

The line paragraph illustrates the most prefered fast-food restaurants ( McDonald’s, KFC, Burger King) among the teenagers in vietnam an Indonesia in the year of 2017, and shows a prediction of how it will be in 2027. In Vietnam, Burger King was the most prefered resturant by 52.8% of teenager while Mcdonalds was a close […]

The graph show the energy consumption and emission of greenhouse gases from Australian household.

The pie charts illustrate the consumption of energy and greenhouse gas emissions, which resulted from the energy use in an average Australian household. It is evident that the Australian household used the highest amount of energy for heating, which is also the major source of greenhouse gas emission and utilised a minimal amount of power […]

See All
We have detected unusual activity on your device.
Please verify your identity to continue.
Note: This verification step won't sign you in. If you have a premium account, please log in to access the service as usual.
Google/Gmail Verification
Or verify using Email/Code
We've sent a verification code to:
youremail@gmail.com (Not your email?)
Enter it below to complete the verification process.
Ensure your email address is correct, your inbox is not full, and you check your spam folder. If no email arrives, consider using an alternative email.
You will need a Premium plan to perform your action!
Note: If you already have a premium account, please log in to access our services as usual.

Plans & Pricing

Our mission is to make quality education accessible for everyone.
However, to keep our hardworking team running and this service alive, we genuinely need your support!
By opting for a premium plan, not only do you sustain us in achieving the mission, but you also unlock advanced features to enrich your learning experience.

Free

For learners who aren't pressed for time

What's included on Free
100+ Cambridge IELTS Tests
Instant IELTS Writing Task 1 & 2 Evaluation (2 times/month)
Instant IELTS Speaking Part 1, 2, & 3 Evaluation (5 times/month)
Instant IELTS Writing Task 1 & 2 Essay Generator (2 times/month)
500+ Dictation & Shadowing Exercises
100+ Pronunciation Exercises
Flashcards
Other Advanced Tools

Premium

For those serious about advancing their English proficiency, and for IELTS candidates aspiring to boost their band score by 1-2 points (especially in writing & speaking) in just 30 days or less

What's included on Premium
Save Your IELTS Test Progress
Unlock All Courses & IELTS Tests
Unlimited AI Conversations
Unlimited AI Writing Enhancement Exercises
Unlimited IELTS Writing Task 1 & 2 Evaluation
Unlimited IELTS Speaking Part 1, 2, & 3 Evaluation
Checked Answers Will Not Be Published
Unlimited IELTS Writing Task 1 & 2 Essay Generator
Unlimited IELTS Speaking Part 1, 2, & 3 Sample Generator
Unlimited Usage Of Advanced Tools
Priority Support within 24h (12-month plan only)

Due to the nature of our service and the provided free trials, payments are non-refundable.
Nếu bạn là người Việt Nam và không có hoặc không muốn trả bằng credit/debit cards, bạn có thể thanh toán bằng phương thức chuyển khoản:


Chọn gói:
419,000₫ 277,000 ₫ cho gói 1 tháng (chỉ 9,233₫/ngày)
1,239,000₫ 597,000 ₫ cho gói 3 tháng (chỉ 6,633₫/ngày)
2,469,000₫ 1,027,000 ₫ cho gói 6 tháng (chỉ 5,706₫/ngày)
4,929,000₫ 1,417,000 ₫ cho gói 12 tháng (chỉ 3,936₫/ngày)


Sau khi chuyển khoản, vui lòng đợi trình duyệt tự động điều hướng bạn trở lại Engnovate và bạn sẽ ngay lập tức nhận được mã kích hoạt tài khoản premium.
Nếu có lỗi xảy ra, bạn có thể liên hệ với team thông qua một trong các phương thức: email đến helloengnovate@gmail.com hoặc nhắn tin qua facebook.com/engnovate.
Vì toàn bộ công cụ trên website đều có thể sử dụng thử miễn phí, Engnovate không hỗ trợ hoàn tiền.