🔥 Today Only: Save 30% on Premium — Offer Ends Soon! - Upgrade Now!
Multiple Graphs

Band 8+: Task 1 - The bar chart below shows the estimated sales of jeans for two companies next year in Turkey. The pie chart shows the projected market share of the two companies in jeans at the end of search next year.

Image for topic: Task 1 - The bar chart below shows the estimated sales of jeans for two companies next year in Turkey. The pie chart shows the projected market share of the two companies in jeans at the end of search next year.
Our system will evaluate the answer based on this AI-generated description.
The image shows a bar chart comparing monthly sales in thousands of pairs for Mango Co. and Jack & Jones Co. from January to December, with Mango Co. consistently selling fewer pairs: Jan (Mango Co. ~100, Jack & Jones Co. ~200), Feb (Mango Co. ~150, Jack & Jones Co. ~300), Mar (Mango Co. ~200, Jack & Jones Co. ~400), Apr (Mango Co. ~250, Jack & Jones Co. ~500), May (Mango Co. ~300, Jack & Jones Co. ~550), June (Mango Co. ~300, Jack & Jones Co. ~600), July (Mango Co. ~350, Jack & Jones Co. ~650), Aug (Mango Co. ~350, Jack & Jones Co. ~700), Sept (Mango Co. ~400, Jack & Jones Co. ~750), Oct (Mango Co. ~450, Jack & Jones Co. ~800), Nov (Mango Co. ~500, Jack & Jones Co. ~850), Dec (Mango Co. ~550, Jack & Jones Co. ~950). A pie chart displays the projected market share with Mango Co. at 30%, Jack & Jones Co. at 50%, and Others at 20%.
Given the complexity of the image, the above description may not be entirely accurate.
Note: Both the topic and the answer were created by one of our users.

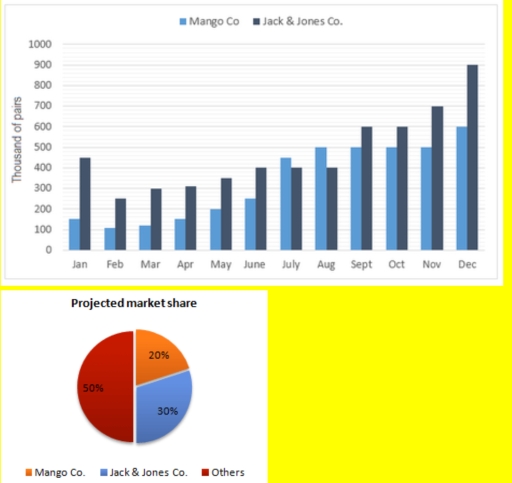
The diagrams depict the annual sales of jeans by Mango Co. and Jack & Jones Co. in Turkey next year, alongside the forecast distribution of market share among several brands by the end of that year.

Overall, both companies are expected to achieve their highest sales figures in December, with Jack & Jones projected to dominate both total sales and market shares.

Initially, Jack and Jones is forecast to sell approximately 450,000 pairs of jeans, substantially exceeding Mango’s projected sales of around 150,000 pairs. Although Jack & Jones’ sales are predicted to decline sharply in February, they are expected to recover steadily thereafter, reaching a peak of nearly 900,000 pairs in December. By contrast, Mango’s sales remain relatively stable during the first quarter before rising significantly in August by about 350,000 pairs and ultimately peaking at approximately 600,000 pairs at the end of the year.

In terms of market share, Jack & Jones is projected to account for one-third of total share, making it the leading brand. Mango is expected to secure 20% of the market share, while the remaining 50% is attributed to other competitors collectively.

Word Count: 187

Answers On The Same Topic:

Task 1 – The bar chart below shows the estimated sales of jeans for two companies next year in Turkey. The pie chart shows the projected market share of the two companies in jeans at the end of search next year.

The bar chart illustrates sales of jeans for two turkish companies for the next year. And pie chart shows all rejected sale shares of these two companies in the end of the year. Overall both of the charts illustrates obvious dominate of sales of Jack & Jones Co. In the beginning of the year Jack […]

Task 1 – The bar chart below shows the estimated sales of jeans for two companies next year in Turkey. The pie chart shows the projected market share of the two companies in jeans at the end of search next year.

The illustration compares the expected shares for the next years of two companies that produce jeans in Turkey as well as assumed market share of these companies at the end of next year. Overall, Jack&Jones company will primarily dominate in both charts, gradually increasing its sales despite a sudden decrease in the beginning, while Mango […]

Task 1 – The bar chart below shows the estimated sales of jeans for two companies next year in Turkey. The pie chart shows the projected market share of the two companies in jeans at the end of search next year.

The bar graph illustrates how many jeans given two companies, namely Jack & Jones and Manngo companies, will sell in the following year, whereas the pie chart compares the projected market share about jeans sales in the next year. Overall, it is predicted that Jack & Jones company get more consumer in the most of […]

Task 1 – The bar chart below shows the estimated sales of jeans for two companies next year in Turkey. The pie chart shows the projected market share of the two companies in jeans at the end of search next year.

The bar chart illustrates the information on the sales of jeans prediction rate in two companies at the end the year in Thurkey,while the pie chart presents their estimation of market shares.Overall,the projection of sales in both ccompanies is to have a considerable increase throughout the 12 months,while jack and Jones company represents the highest […]

See All

Other Topics:

The charts below illustrate the proportions of American students at a university in the United States who were able to speak languages other than English, in 2005 and 2015. Summarise the information by selecting and reporting the main features, and make comparisons where relevant.

The two pie charts compare the percentage of American students in Unated States who able to speak on other languages from 2005 and 2015. Overall, it is easy to notice that the interest of the students in other language is increased significanlty after 10 years. In 2005, the share of residents who were not able […]

The pie charts above show a comparison of kinds of energy production in a European country in 1995 and 2005.

Overall, the two pie charts illustrate the distribution of energy production in France over a 10-year period. It is evident that coal and gas remained the dominant energy sources in both 1995 and 2005, while nuclear power and other alternative sources accounted for a smaller share. Notably, the contribution of the latter categories almost doubled […]

The pie charts above show a comparison of kinds of energy production in a European country in 1995 and 2005.

Overall, the two of pie charts show that all kind of energy production were still in demand even over 10 year period in FranceComparing the data in 1995 and 2005 ,it is clear that coal and gas were the most important energy sourse,whereas the others and nucleasr were used less.Since 1995, the latter sourse has […]

Some people think that students should study only subjects related to their future career. Others believe that learning a wide range of subjects is more important. Discuss both views and give your opinion

Nowadays, there is an ongoing debate about many people believe that student who studied only subject build succesful career on future.Others thought that students shoul improve cognitive skills with learning wide range of subjects.This essay will discuss both views and give my opinion. On the one hand,some people think that students who learned a only […]

Writing Task 1: Pie Chart & Table You should spend about 20 minutes on this task The charts below show the distribution of the world's water and the use of water in three countries.

The provided pie charts and table compare how the world’s water is divided and used among 3 distinct nations. At a glance, it is obvious that saltwater dominates all water resources, while ice and glaciers showed the maximum for fresh water. Another noteworthy point is that the higher rates for water usage in agriculture in […]

The pie charts below show the methods used by international students when booking online English courses in three different countries in 2009 and 2010. Summarise the information by selecting and reporting the main features, and make comparisons where relevant.

The pie charts compare the proportions of students using various types of methods to sign up for English courses in three different nations in 2009 and 2010. Overall, while the internet became the most popular method in Australia, pre-booking with an agent became the most common choice in the USA and Canada by the end […]

See All
We have detected unusual activity on your device.
Please verify your identity to continue.
Note: This verification step won't sign you in. If you have a premium account, please log in to access the service as usual.
Google/Gmail Verification
Or verify using Email/Code
We've sent a verification code to:
youremail@gmail.com (Not your email?)
Enter it below to complete the verification process.
Ensure your email address is correct, your inbox is not full, and you check your spam folder. If no email arrives, consider using an alternative email.
You will need a Premium plan to perform your action!
Note: If you already have a premium account, please log in to access our services as usual.

Plans & Pricing

Our mission is to make quality education accessible for everyone.
However, to keep our hardworking team running and this service alive, we genuinely need your support!
By opting for a premium plan, not only do you sustain us in achieving the mission, but you also unlock advanced features to enrich your learning experience.

Free

For learners who aren't pressed for time

What's included on Free
100+ Cambridge IELTS Tests
Instant IELTS Writing Task 1 & 2 Evaluation (2 times/month)
Instant IELTS Speaking Part 1, 2, & 3 Evaluation (5 times/month)
Instant IELTS Writing Task 1 & 2 Essay Generator (2 times/month)
500+ Dictation & Shadowing Exercises
100+ Pronunciation Exercises
Flashcards
Other Advanced Tools

Premium

For those serious about advancing their English proficiency, and for IELTS candidates aspiring to boost their band score by 1-2 points (especially in writing & speaking) in just 30 days or less

What's included on Premium
Save Your IELTS Test Progress
Unlock All Courses & IELTS Tests
Unlimited AI Conversations
Unlimited AI Writing Enhancement Exercises
Unlimited IELTS Writing Task 1 & 2 Evaluation
Unlimited IELTS Speaking Part 1, 2, & 3 Evaluation
Checked Answers Will Not Be Published
Unlimited IELTS Writing Task 1 & 2 Essay Generator
Unlimited IELTS Speaking Part 1, 2, & 3 Sample Generator
Unlimited Usage Of Advanced Tools
Priority Support within 24h (12-month plan only)

Due to the nature of our service and the provided free trials, payments are non-refundable.
Nếu bạn là người Việt Nam và không có hoặc không muốn trả bằng credit/debit cards, bạn có thể thanh toán bằng phương thức chuyển khoản:


Chọn gói:
419,000₫ 277,000 ₫ cho gói 1 tháng (chỉ 9,233₫/ngày)
1,239,000₫ 597,000 ₫ cho gói 3 tháng (chỉ 6,633₫/ngày)
2,469,000₫ 1,027,000 ₫ cho gói 6 tháng (chỉ 5,706₫/ngày)
4,929,000₫ 1,417,000 ₫ cho gói 12 tháng (chỉ 3,936₫/ngày)


Sau khi chuyển khoản, vui lòng đợi trình duyệt tự động điều hướng bạn trở lại Engnovate và bạn sẽ ngay lập tức nhận được mã kích hoạt tài khoản premium.
Nếu có lỗi xảy ra, bạn có thể liên hệ với team thông qua một trong các phương thức: email đến helloengnovate@gmail.com hoặc nhắn tin qua facebook.com/engnovate.
Vì toàn bộ công cụ trên website đều có thể sử dụng thử miễn phí, Engnovate không hỗ trợ hoàn tiền.