🔥 Today Only: Save 30% on Premium — Offer Ends Soon! - Upgrade Now!
Table

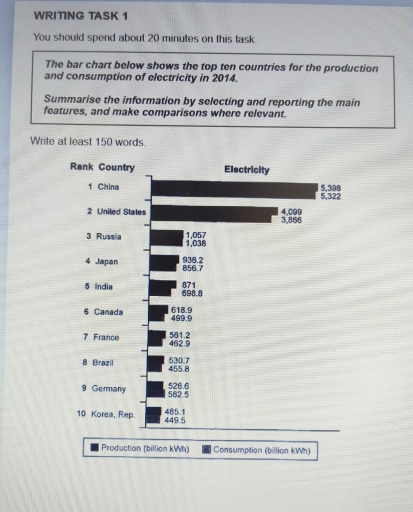
Band 6+: The bar chart below shows the top ten countries for the production and consumption of electricity in 2014. Summarise the information by selecting and reporting the main features, and make comparisons where relevant.

Image for topic: The bar chart below shows the top ten countries for the production and consumption of electricity in 2014. Summarise the information by selecting and reporting the main features, and make comparisons where relevant.
Our system will evaluate the answer based on this AI-generated description.
The image displays a bar chart with two sets of bars for each of the top ten countries, one representing production and the other consumption of electricity in 2014, with production in the first bar and consumption in the second for each pair. Production and consumption are measured in billion kWh. China ranks first with production at 5,398 and consumption at 5,322, followed by the United States with production at 4,099 and consumption at 3,866. Russia is third with production at 1,057 and consumption at 1,038. Japan's production is 936.2 and consumption is 857.6, coming in fourth. India, in fifth place, shows production at 871 and consumption at 698.8. Canada has a production of 619.9 and consumption at 518, taking the sixth spot. Seventh-ranked France shows production at 529.9 and consumption at 462.9. Brazil, in eighth place, has production at 530.7 and consumption at 455.8. Germany, ranking ninth, shows production at 526.6 and consumption at 582.5. The tenth-ranked Korea, Rep. has production at 485.1 and consumption at 449.5. There is a key at the bottom indicating production with a full bar and consumption with a striped bar.
Given the complexity of the image, the above description may not be entirely accurate.
Note: Both the topic and the answer were created by one of our users.

The bar chart illustrates the production and consumption of electricity among the top ten countries in 2014.

Overall, China and the United States recorded the highest levels of electricity production and consumption, while South Korea had the lowest figures in both categories.

China recorded the highest figures for the production and consumption of electricity

at 5,398 and 5,322, respectively. The second-largest is that the US accounted for 4,099 billion kWh of production, and 3,866 billion kWh of consumption. Followed by Russia with figures far lower than the United States and had similar number between production and consumption of electricity at 1,057 and 1,038, respectively.

The electricity was produced and consumed from Japan at 936,2 and 856,7, respectively. India followed closely behind with 871 of production, and 698,8 of consumption. Canada recorded in both variables below 620,0. France, Brazil, and Germany experienced an average number around 500,0 billion kWh. The smallest figures for the production and consumption of electricity compared to the other countries was South Korea at just below 500,0 billion kWh.

Word Count: 172

Answers On The Same Topic:

The bar chart below shows the top ten countries for the production and consumption of electricity in 2014. Summarise the information by selecting and reporting the main features, and make comparisons where relevant.

he bar chart compares the production and consumption of electricity for the top ten countries in 2014. It is clear that China and the United States produced and consumed the largest proportion of electricity among all the other countries. In contrast, Brazil, Germany and Korea showed the lowest figures among the top 10 countries. Except […]

The bar chart below shows the top ten countries for the production and consumption of electricity in 2014. Summarise the information by selecting and reporting the main features, and make comparisons where relevant.

The chart illustrates how much electricity had been produced and consumed by ten nations in 2014. Overall, it was discernible from the bar chart that the production of electricity in ten countries was the highest. Notably, the electricity which was produced and consumed in Korea Republic was the lowest throughout the surveyed. Turning to production […]

The bar chart below shows the top ten countries for the production and consumption of electricity in 2014. Summarise the information by selecting and reporting the main features, and make comparisons where relevant.

The bar chart compares the best 10 countries for the production and using of electricity in 2014. It is clear that China was the world’s most popular country for the production electricity in 2014. However, the USA saw a rise of large of prodaction, but fewer than China. In that year, China’s prodaction and consamption […]

The bar chart below shows the top ten countries for the production and consumption of electricity in 2014. Summarise the information by selecting and reporting the main features, and make comparisons where relevant.

The chart gives information on ten countries that has generated and consumed the most amount of electricity in 2014. Overall, the electricity that produced by a country, is similar to the electricity value that consumed by the same country. China is the leading country in both electricity production and consumption where Korea Republic has the […]

See All

Other Topics:

The table below shows the percentage of household and electronic goods in New Zealand in 2002 and 2020. Summarize the information by selecting and eporting the main features and make comparisions where relavant

The illustrates the percentage of household and electronic goods usage in New Zealand in the years 2002 and 2020. Notably, the washing machine and the color tv has the highest figures among the electronic devices with over 95% usuage for both machines int the two years. In the domain of washing machine and color tv […]

The table shows the tourist numbers and tourist spending in five countries in 2012 and 2013. Summarise the information by selecting and reporting the main features and make comparison where relevant.

The table illustrates the number of tourists and tourist spending in five countries in 2012 and 2013. Overall, France had the highest number of tourists in both years. However, the USA had the highest tourist spending. One interesting point is that the number of tourists in China decreased, while spending increased slightly. In 2012, Spain […]

The table below shows the percentage of children with different educational problems in two primary schools (School A and School B) in the years 2005 and 2015. Summarize the information by selecting and reporting the main features, and make comparisons where relevant.

The table chart illustrates the information the proportion of students in two seperate primary schools(schoolA and schoolB)who struggled with seven distinct academic issues in 2005 and Overall, the percentage of kids with acedemic problems in school A decreased in the second given year , expect those suffered from reading ability. Whereas , the highest proportion […]

The table below shows the average daily temperatures and the number of rainy days in five cities over the course of a year. City Average Temperature (°C) Number of Rainy Days London 12.5 160 Tokyo 15.2 120 New York 10.1 200 Sydney 18.3 90 Mexico City 22.0 50

The data shows the average daily temperatures and the number of rainy days over a year in five cities. From the data above, it shows that the higher the average temperature, it will give a lower number of rainy days in a year. New York has 10.1 celcius, being the lowest average temperature between five […]

The table below shows the amount of waste produced in six different countries over a twenty-year period.

The given table illustrates how much waste was produced in six major nations throughout a twenty-year period, starting from 1980 to 2000. Overall, the US had the most significant amounts of pollution created across all the countries, whereas Ireland and Portugal were among the least. In addition, countries such as Korea and Ireland lacked of […]

The table provides the detailed breakdown of the number of full-time students came from India and studied in various universities in the United Kingdom between two consecutive sessions from 2020/21 to 2021/22.

The table provides data on the number of full-time Indian students,who studied at different universities in the UK in 2020/21 and 2021/22. Overall,all universities experienced an increase over the period.Sheffield university recorded the largest increase in student numbers,whereas BPP University demonstrated the smallest rise. In 2020/21,BPP University had the highest number of students with 3,505 […]

See All
We have detected unusual activity on your device.
Please verify your identity to continue.
Note: This verification step won't sign you in. If you have a premium account, please log in to access the service as usual.
Google/Gmail Verification
Or verify using Email/Code
We've sent a verification code to:
youremail@gmail.com (Not your email?)
Enter it below to complete the verification process.
Ensure your email address is correct, your inbox is not full, and you check your spam folder. If no email arrives, consider using an alternative email.
You will need a Premium plan to perform your action!
Note: If you already have a premium account, please log in to access our services as usual.

Plans & Pricing

Our mission is to make quality education accessible for everyone.
However, to keep our hardworking team running and this service alive, we genuinely need your support!
By opting for a premium plan, not only do you sustain us in achieving the mission, but you also unlock advanced features to enrich your learning experience.

Free

For learners who aren't pressed for time

What's included on Free
100+ Cambridge IELTS Tests
Instant IELTS Writing Task 1 & 2 Evaluation (2 times/month)
Instant IELTS Speaking Part 1, 2, & 3 Evaluation (2 times/month)
Instant IELTS Writing Task 1 & 2 Essay Generator (2 times/month)
500+ Dictation & Shadowing Exercises
100+ Pronunciation Exercises
Flashcards
Other Advanced Tools

Premium

For those serious about advancing their English proficiency, and for IELTS candidates aspiring to boost their band score by 1-2 points (especially in writing & speaking) in just 30 days or less

What's included on Premium
Save Your IELTS Test Progress & Analyze Mistakes By Question Type
Save Your Own Flashcard Sets & Use Them On Any Device
Unlock All Courses, IELTS Tests, Section & Part Practice
Unlimited AI Conversations
Unlimited AI Writing Enhancement Exercises
Unlimited IELTS Writing Task 1 & 2 Evaluation
Unlimited IELTS Speaking Part 1, 2, & 3 Evaluation
Checked Answers Will Not Be Published
Unlimited IELTS Writing Task 1 & 2 Essay Generator
Unlimited IELTS Speaking Part 1, 2, & 3 Sample Generator
Unlimited Usage Of Advanced Tools & AI Features
Priority Support within 24h (12-month plan only)

Due to the nature of our service and the provided free trials, payments are non-refundable.