Our system will evaluate the answer based on this AI-generated description.
The image displays a bar chart with bars representing years 2002 (yellow), 2003 (red), 2004 (green), 2005 (blue), 2006 (purple), and 2007 (orange). The activities labeled are "going to the disco," "watching television," "doing homework," "washing the car," "do household chores," "gardening," "going out." Numbers range from 0 to 40 in increments of 5. "Going to the disco" - 2002: ~33, 2003: ~18, 2004: ~31, 2005: ~23, 2006: ~33, 2007: ~27 hours. "Watching television" - 2002: ~34, 2003: ~36, 2004: ~35, 2005: ~36.5, 2006: ~37, 2007: ~34. "Doing homework" - 2002: ~15.5, 2003: ~17, 2004: ~20, 2005: ~17.5, 2006: ~10, 2007: ~17. "Washing the car" - 2002: ~5.5, 2003: ~6, 2004: ~2, 2005: ~3.5, 2006: ~3, 2007: ~2. "Do household chores" - 2002: ~13, 2003: ~13.5, 2004: ~11.5, 2005: ~11, 2006: ~10, 2007: ~16. "Gardening" - 2002: ~5, 2003: ~5.5, 2004: ~3, 2005: ~4, 2006: ~5, 2007: ~2. "Going out" - 2002: ~9, 2003: ~10, 2004: ~12, 2005: ~10, 2006: ~12, 2007: ~9.
Given the complexity of the image, the above description may not be entirely accurate.
Skyrocket your IELTS band score by 1-2 points in under a month with our premium plan!
Note: Both the topic and the answer were created by one of our users.
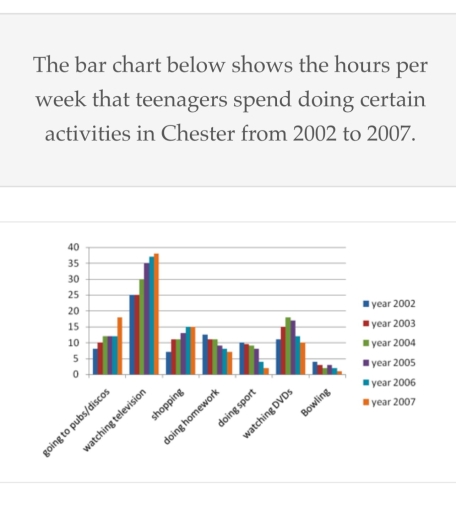
The bar chart demonstrates that how much time per week the teenagers spend by doing certain activities ( such as going pubs/discos, watching television, shopping, doing homework, doing sport,watching DVDs and bowling) in Chester between 2002 and 2007.
Overall, according to the graph, we can see,during the given period, the younger’s spend their highest amount of time by watching television and lowest amount of time in bowling.
In the given period, teenagers always very much keen on watching television and it reached It’s peak point in 2007 which was well under 40 hours per week.In terms of going pubs,watching television and shopping, the amount of hours per week increased gradually. But in terms of doing homework, doing sport and bowling, the time scale decreased gradually and the lowest amount of hours of those three activities was well under 5 hours,about 10 hours and just over 0 hours respectively which was in 2007.
However, in watching DVDs, the spending hours per week was fluctuating during the given period and reach It’s peak point in 2004 which was in the middle of 15 hours and 20 hours per week.
Word Count: 187
