Our system will evaluate the answer based on this AI-generated description.
The image displays a bar chart with vertical bars representing three different years identified by labels: 2003, 2005, and 2007, organized by days of the week from Monday to Sunday along the horizontal axis. The Y-axis measures numerical values from 0 to 50 in increments of 5. Here are the approximate data for each day and year: Monday: 2003 (~10 units), 2005 (~17 units), 2007 (~12 units); Tuesday: 2003 (~12 units), 2005 (~21 units), 2007 (~14 units); Wednesday: 2003 (~15 units), 2005 (~28 units), 2007 (~22 units); Thursday: 2003 (~18 units), 2005 (~32 units), 2007 (~30 units); Friday: 2003 (~48 units), 2005 (~45 units), 2007 (~44 units); Saturday: 2003 (~43 units), 2005 (~40 units), 2007 (~45 units); Sunday: 2003 (~42 units), 2005 (~37 units), 2007 (~40 units). The bars are grouped closely together in sets of three (one bar for each year) under the label of each day, providing a clear visual comparison across the days of the week for each year included in the dataset.
Given the complexity of the image, the above description may not be entirely accurate.
Skyrocket your IELTS band score by 1-2 points in under a month with our premium plan!
Note: Both the topic and the answer were created by one of our users.
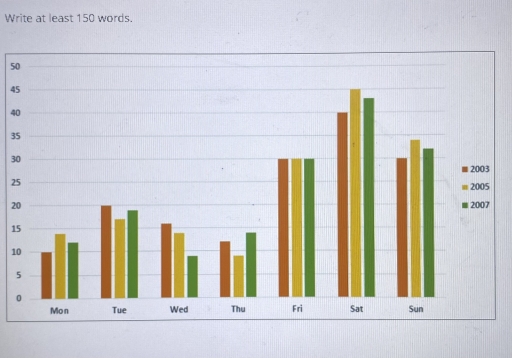
The bar graph performs the cinema visiting in one country in Europe in different week days between 2003 and 2007.
Overall, the lowest bar percentage was at the beginning of the week between Monday and Thursday. Another point that should also be highlighted is that the most cinema visiting day is Saturday.
The bar shows that on Monday the most people attended cinema was on 2005. While on Thursday the 20% of people visited cinema in 2003. On Wednesday numerous individuals attended cinema in 2005 at about 16%. On Thursday the highest percentage of cinema visiting at about 15% reached in 2007 and attendance reached the lowest point on Thursday in 2005.
On the last 3 days of the week the percentage of visiting cinemas was higher than between Monday and Thursday. On Friday all bars were on the same level and reached at about 30%. The highest point of cinemas visiting hit in 2005 at about 45%. On Sunday bars decreased, ended at about 30% in 2003, almost 35% in 2006 and 34% in 2007. Although at the end of the week all bars decreased, the highest point of visiting cinemas richer on Saturday in 2005 and the lowest point was hit in Thursday in 2005.
Word Count: 207