Our system will evaluate the answer based on this AI-generated description.
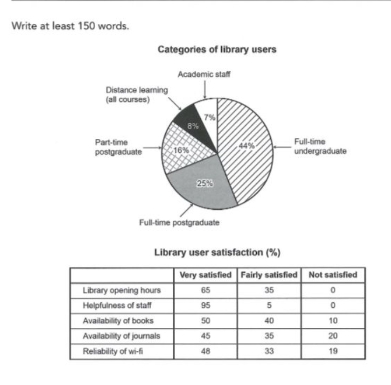
The image contains a pie chart titled 'Categories of library users' and a table titled 'Library user satisfaction (%)'. The pie chart breaks down library users as follows: Full-time undergraduate 44%, Full-time postgraduate 25%, Part-time postgraduate 16%, Distance learning (all courses) 8%, and Academic staff 7%. The table shows satisfaction levels for five categories: For Library opening hours, 65% were Very satisfied, 35% Fairly satisfied, and 0% Not satisfied. For Helpfulness of staff, 95% were Very satisfied, 5% Fairly satisfied, and 0% Not satisfied. For Availability of books, 50% were Very satisfied, 40% Fairly satisfied, and 10% Not satisfied. For Availability of journals, 45% were Very satisfied, 35% Fairly satisfied, and 20% Not satisfied. For Reliability of wi-fi, 48% were Very satisfied, 33% Fairly satisfied, and 19% Not satisfied.
Given the complexity of the image, the above description may not be entirely accurate.
Skyrocket your IELTS band score by 1-2 points in under a month with our premium plan!
Note: Both the topic and the answer were created by one of our users.
The pie chart illustrates five categories of individuals who visit the library, while the table depicts their satisfaction.
Overall, the largest proportion of all library users was composed of students, with regards to satisfaction most visitors were either very or fairly satisfied by the facilities provided.
In the pie chart, full time undergraduate students made up nearly half of all visitors with 44%. Full-time postgraduates made up exactly a quarter of all travellers. Following on from this, part-time postgraduates made up a significant portion with 16%. Finally, distance learning and academic staff made up the smallest share with 8% and 7%, respectively.
In the table, most customers were very satisfied with the opening hours and the staffs assistance with 65% and 95% very satisfied and the remaining value being completed by fairly satisfied. In contrast, clients were less impressed with the availability of books, journals and the wifi with only 90%, 80% and 81%, respectively having any form of satisfaction and 10%, 20% and 19%, respectively being unimpressed entirely.
Word Count: 169
