Our system will evaluate the answer based on this AI-generated description.
The image depicts a bar chart showing the percentage of total people that work in Grahamston using different modes of transport in 1996 and 2001, with a footnote mentioning that "Other*" includes ferry, aeroplane, and taxi. The x-axis measures from 0 to 70 in increments of 10 percentage points, and the y-axis lists modes of transport in descending order as follows: Drove car or truck, Public transport, Bicycle, Walked, Worked at home, Private vehicle passenger, and Other*. For 1996, the percentages are approximately: Drove car or truck 60%, Public transport 50%, Bicycle 20%, Walked 10%, Worked at home 5%, Private vehicle passenger 15%, Other* 5%. For 2001, the percentages are approximately: Drove car or truck 65%, Public transport 40%, Bicycle 13%, Walked 20%, Worked at home 8%, Private vehicle passenger 12%, Other* 3%. The bars are depicted in pairs for each mode of transport, with one bar representing 1996 and one bar representing 2001.
Given the complexity of the image, the above description may not be entirely accurate.
Skyrocket your IELTS band score by 1-2 points in under a month with our premium plan!
Note: Both the topic and the answer were created by one of our users.
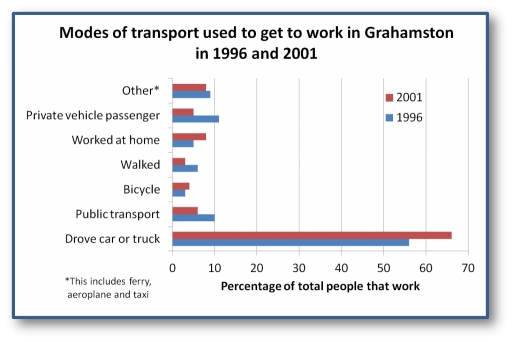
The graph illustrate types of movement that people used to get to job in Grahamston from 1996 to 20001.
In general, percentage of exploit drove car and truck rose dramatically between 1996 and 2001, while the other transport didn’t get any popularity as compared to driving car or truck. However demand of worked at home grow relative to other transport.
Examining the graph, we can see that drove car or truck became widespread among people, from 1996 drove and truck had about 55% used to get to work, moreover percentage of used to get destination increase every year. Private vehicle for passengers significant fall from 1996, the percentage decrease from 11% to 5%. Public transport, bicycle, walked, didn’t get any global difference contrast to drove car or truck and private vehicle for passenger. Worked at home started recruit popularity at 2001, the percentage climb from 5% to 9%. Other transport that includes taxi, aircraft, ferry also hadn’t any overall change, from 1996 percentage rose by 1%.
Word Count: 166