Our system will evaluate the answer based on this AI-generated description.
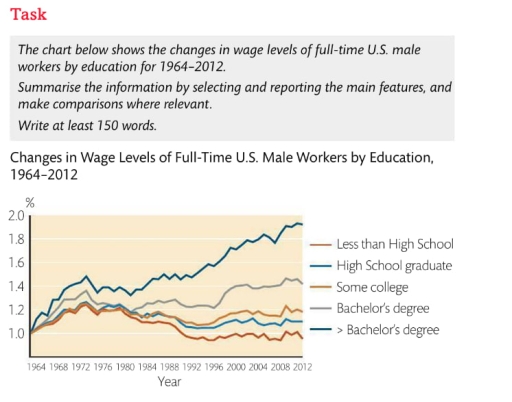
The image shows a line chart of wage levels for full-time U.S. male workers by education from 1964 to 2012. In 1964, less than high school was at 1.0, high school graduate at 1.0, some college at 1.0, bachelor's degree at approximately 1.54, and >bachelor's degree at approximately 1.68. By 1972, less than high school rose slightly above 1.0, high school graduate was at 1.2, some college at 1.25, bachelor's degree just under 1.8, and >bachelor's degree at approximately 1.9. In 1984, levels were as follows: less than high school at 1.1, high school graduate below 1.3, some college at approximately 1.4, bachelor's degree at 1.6, and >bachelor's degree peaking at 1.9. By 1996, less than high school dropped below 1.0, high school graduate near 1.1, some college about 1.2, bachelor's degree above 1.5, and >bachelor's degree at 1.8. In 2004, less than high school remained at 0.9, high school graduate just above 1.0, some college near 1.2, bachelor's degree around 1.6, >bachelor's degree at 1.9. Finally, in 2012, less than high school stayed at 0.8, high school graduate at 1.0, some college at 1.2, bachelor's at 1.6, with >bachelor's degree reaching 1.9.
Given the complexity of the image, the above description may not be entirely accurate.
Skyrocket your IELTS band score by 1-2 points in under a month with our premium plan!
Note: Both the topic and the answer were created by one of our users.
The chart below describes changes in wage levels as a percentage of full-time U.S. male workers by education from 1964 to 2012.
Overall, this graph shows clear growth in the wages of all men who had completed their education; however, the wages of those who had not finished even school had declined.
In this graph, in 1964, wages for all types of male workers had a starting point of one percent. It is clear that by 1972, those who had received education higher than a bachelor’s degree had raised their wages over one point four percent, while others had only increased their wages to over one point two percent. Despite a relative downfall in wages between 1976 and 1984, wages for master’s degree graduates had risen to over one point eight percent by 2012.
In sharp contrast, wages for those who had not finished high school, despite growth in 1972, had decreased to less than they were in 1964.
Word Count: 159