Our system will evaluate the answer based on this AI-generated description.
The image shows a bar graph with data from 5 countries—Great Britain, Australia, New Zealand, United States, and Canada—across 6 decades—1930, 1940, 1950, 1960, 1970, 1980. Units on Y-axis range from 0 to 160 with intervals of 20. In 1930, Great Britain and Australia have identical highest values at 120, followed by New Zealand at 100, the United States at 80, and Canada at 60. In 1940, Australia leads at 160, Great Britain at 140, New Zealand at 120, the United States at 100, and Canada at 80. For 1950, Australia's value decreases to 140, Great Britain and New Zealand both at 120, the United States at 100, and Canada at 80. In 1960, New Zealand's data rises to 140, Great Britain at 120, Canada increases to 100, Australia drops to 100, and the United States remains at 100. The 1970 data show New Zealand and Great Britain both at 120, the United States at 100, Australia at 80, and Canada at 60. Finally, in 1980, Australia, United States, and Canada are at 100, Great Britain at 80, and New Zealand drops to 60.
Given the complexity of the image, the above description may not be entirely accurate.
Skyrocket your IELTS band score by 1-2 points in under a month with our premium plan!
Note: Both the topic and the answer were created by one of our users.
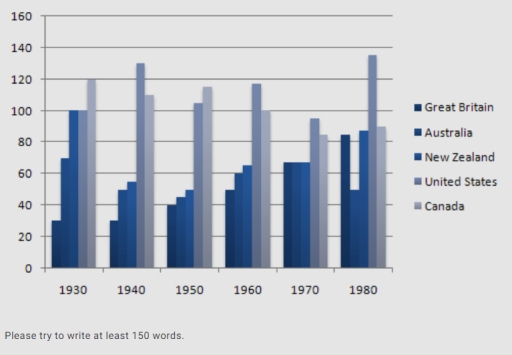
The information about imprisonment in five distinct countries between 1930 and 1980 is illustrated on the bar chart. Overall, the graph indicates the imprisonment level in the United States and Canada as the highest ones over the decades. Additionally, except for the United States of America, the indicators representing the data for all the countries had decreased over time.
In detail, initially, the figures for imprisonment in the United Kingdom and Australia were indicated at the approximate points of 30 and 70, respectively. Subsequent increase of the British indicator made the index of imprisonment reach 82 in 1980. In contrast, the indicator of Australian imprisonment level diminished to a little above 45.
Furthermore, after the data for imprisonment in countries such as New Zealand, the United States, and Canada had been fluctuating for 40 years, it had finally reached the indexes of 85 in New Zealand by decreasing from 100, 135 in the United States by growing by approximately 35, and 85 in Canada by decreasing from 120.
Word Count: 168
