Our system will evaluate the answer based on this AI-generated description.
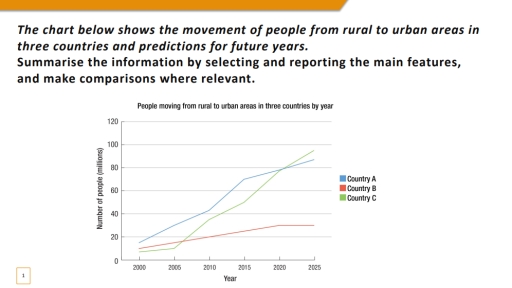
The image displays a line graph showing the number of people (millions) moving from rural to urban areas in Country A, Country B, and Country C from 2000 to 2025. In 2000, Country A had ~10 million, Country B had ~5 million, and Country C had ~2 million. By 2005, Country A rose to ~15 million, Country B remained at ~5 million, and Country C reached ~7 million. In 2010, Country A increased to ~25 million, Country B stayed at ~5 million, and Country C surged to ~20 million. By 2015, Country A was at ~40 million, Country B showed a slight rise to ~10 million, and Country C continued a rapid increase to ~40 million. In 2020, Country A's number dramatically leaped to ~60 million, Country B modestly increased to ~20 million, and Country C peaked at ~80 million. The 2025 projections show Country A leveling off at ~85 million, Country B moderately rising to ~35 million, and Country C slightly exceeding 100 million.
Given the complexity of the image, the above description may not be entirely accurate.
Skyrocket your IELTS band score by 1-2 points in under a month with our premium plan!
Note: Both the topic and the answer were created by one of our users.
The line chart shows the movement of people from rural to urban areas in three countries between 2000 and 2025, including predictions for the future.
Overall, all three countries experienced an increase in the number of people moving to cities. Country A and Country C showed strong growth, while Country B increased more slowly. In 2000, Country A had the highest figure at about 15 million, and this number rose steadily to around 40 million by 2010. After that, it increased sharply, reaching nearly 80 million in 2020, and it is predicted to reach about 85 million in 2025. Country C started with one of the lowest numbers, at around 10 million in 2000, but it grew rapidly after 2005. By 2015, the figure reached approximately 50 million and is expected to rise further to almost 95 million by 2025, becoming the highest among the three countries. In contrast, Country B showed a slow and gradual increase, rising from about 10 million in 2000 to only around 30 million in 2025.
In conclusion, migration to urban areas increased in all three countries, with Country C predicted to have the largest growth by 2025.
Word Count: 193