Our system will evaluate the answer based on this AI-generated description.
The image presents a bar chart depicting the number of jobs in tourism-related industries in a UK city from 1989 to 2009, with separate bars for restaurants, hotels, sport and leisure, and travel and tours for each year. The chart records figures for the years 1989, 1994, 1999, 2004, and 2009. The values for 1989 are as follows: restaurants with approximately 700 jobs, hotels with about 500, sports and leisure with roughly 200, and travel and tours with slightly over 100 jobs. In 1994, the job numbers increase in all sectors with restaurants at approximately 800, hotels around 600, sport and leisure at nearly 500, and travel and tours just above 300. 1999 sees a further rise: restaurants surpassing 900, hotels around 850, sport and leisure close to 750, and travel and tours at 500. In 2004, there is a mixed trend with restaurants reaching almost 1700, hotels over 700, sport and leisure around 850, but travel and tours declines to approximately 400. The final year, 2009, shows a decrease across all industries except for travel and tours which recover to around 600 jobs, while restaurants drop to just over 1400, hotels to 750, and sport and leisure to roughly 550. All trends are illustrated by multiple bars on the y-axis, rising from zero to a maximum of 1800 jobs, with each bar corresponding to a respective industry in the tourism sector.
Given the complexity of the image, the above description may not be entirely accurate.
Skyrocket your IELTS band score by 1-2 points in under a month with our premium plan!
Note: Both the topic and the answer were created by one of our users.
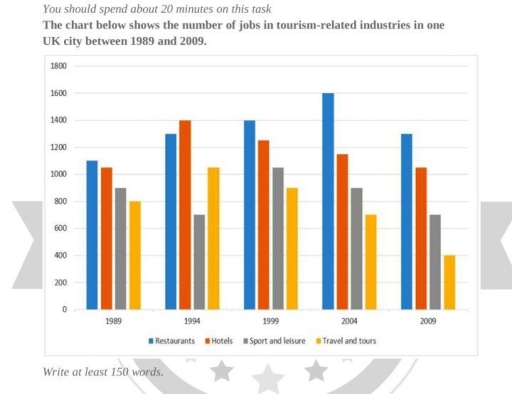
The given bar chart illustrates the number of jobs in tourism-related industries in a UK city between 1989 and 2009.
Overall, employment in restaurants was the highest for most of the period, whereas jobs in travel and tours was generally the lowest among sectors in almost every year, except in 1994.
In 1989, restaurants had the largest employment size, about 1,100 jobs, slightly more than hotels, at around 1,050. The number of jobs in both sectors then increased in 1994, reaching 1,300 and 1,400 respectively, with hotels surpassing restaurants to become the highest. After that, restaurants continued to rise to 1,400 in 1999 and peaked at 1,600 in 2004, before falling to 1,300 in 2009. In contrast, hotel employment steadily declined after 1994, dropping from 1,250 in 1999 to 1,050 in 2009.
Regarding the remaining sectors, sport and leisure had around 900 jobs in 1989 before falling to 700 in 1994. The figure then increased to 1,050 in 1999, but decreased steadily to 900 in 2004 and 700 in 2009. An opposite pattern can be seen in travel and tours, rising from 800 jobs in 1989 to 1,050 in 1994. However, this upward trend was only short-lived because in the following years, its figure then fell continuously, reaching 900 in 1999, 700 in 2004 and only 400 in 2009.
Word Count: 219
