Our system will evaluate the answer based on this AI-generated description.
The image depicts a bar graph showing the percentage of adults using the internet from 2003 to 2006, categorized by age group. For 16-24 age group, the percentages are around 110% for 2003, 115% for 2004, 105% for 2005, and 100% for 2006. For 25-44 age group, percentages are 80% for 2003, 85% for 2004, 80% for 2005, and 75% for 2006. For 45-54 age group, percentages are 70% for 2003, 65% for 2004, 60% for 2005, and 50% for 2006. For 55-64 age group, percentages are 40% for 2003, 45% for 2004, 40% for 2005, and 27% for 2006. For the 65+ age group, percentages are 20% for 2003, 25% for 2004, 20% for 2005, and 17% for 2006. The graph highlights a decline in internet usage across all age groups from 2003 to 2006, with the highest percentages observed in the 16-24 age group, followed by the 25-44, 45-54, 55-64, and the lowest in the 65+ age group.
Given the complexity of the image, the above description may not be entirely accurate.
Skyrocket your IELTS band score by 1-2 points in under a month with our premium plan!
Note: Both the topic and the answer were created by one of our users.
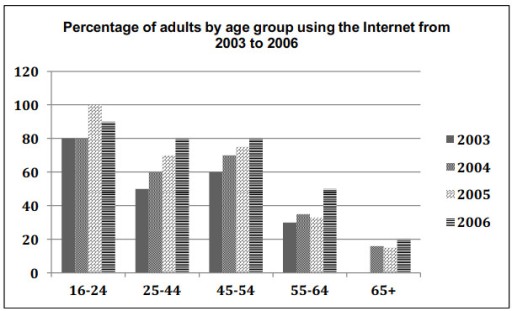
A glance at the bar chart depicts Internet usage throughout four years (from 2003 to 2006) for several categories of British ages.
Overall, it is clear from the illustrated data that the youth adults between 16 and 24 had the highest percentages of using the Internet while the eldest had the lowest in the years from 2003 to 2006.
It can be seen from the graph that there is an increase in the number of people using the Internet from 2003 to 2004 regardless of age. Furthermore, adults between 16 and 24 share the same proportion in 2003 and 2004 of 80%. Then, there was a significant increase in 2005 to 100% followed by a drop to around 90% in 2006.
Moreover, people between (25 and 44) and (45 and 54) had approximately the same trend of increasing from 2003 to 2004. Although the other two groups of ages faced minor fluctuations but still increased.
Word Count: 155