🔥 Today Only: Save 30% on Premium — Offer Ends Soon! - Upgrade Now!
Bar Chart

Band 5+: The chart below shows the percentage of people who ate five portions of fruit and vegetables per day in the UK from 2001 to 2008.

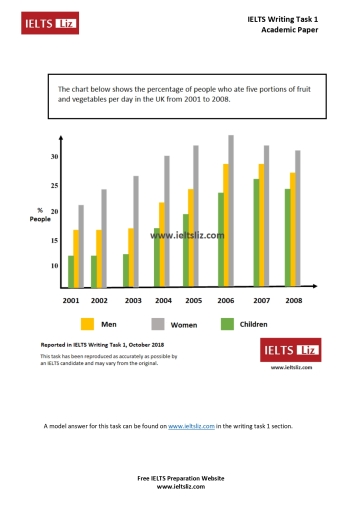
Image for topic: The chart below shows the percentage of people who ate five portions of fruit and vegetables per day in the UK from 2001 to 2008.
Our system will evaluate the answer based on this AI-generated description.
The image is a bar chart displaying the percentage of people who ate five portions of fruit and vegetables per day in the UK from 2001 to 2008, categorized by men, women, and children. In 2001, men were at approximately 22%, women at 25%, and children at 11%. In 2002, men increased to around 23%, women to 26%, and children remained consistent at 11%. 2003 saw a slight decrease for men to about 22.5%, women to 25.5%, and children to 10%. By 2004, men rose to nearly 24%, women to approximately 27%, and children declined to around 9%. In 2005, men reached around 25%, women approximately 29%, and children decreased to 8%. Men had an increase to about 26% in 2006, while women surged to 30% and children to 9%. The year 2007 witnessed men at 27%, women maintaining at 30%, and children at 11%. Lastly, 2008 data indicates men at around 26%, women decreasing to just below 30%, and children increasing to 12%.
Given the complexity of the image, the above description may not be entirely accurate.
Note: Both the topic and the answer were created by one of our users.

The charts illustrate the proportion of individuals who ate five portions of fruit and vegetables per day in the UK from 2001 to 2008.

Overall, it can be clearly seen that all the figures increased significantly but decreased in the last two years. Women had the highest proportion and followed by Men. Children had the lowest percentage during the period.

In detail, Women had approximately 20% of people in 2001 and had jumped to the peak which is about 40% in 2006. Moreover Women declined in 2007 and 2008 to 30%. Furthermore, Men started at approximately 17% and had rise to 28% in 2006 and decline to 26% in 2008.

In terms of Children, the figures showed that Children eat less fruit and vegetables. Children had 12% in 2001 and increased slightly over the period. Until 2006 it reach 23% and had fall to 21% in 2008.

Word Count: 147

Answers On The Same Topic:

The chart below shows the percentage of people who ate five portions of fruit and vegetables per day in the UK from 2001 to 2008.

The bar graph illustrates the proportion of individuals who ate the five portions of fruits and vegetables in the country United kingdom between 2001 and 2008. Overall, In 2001 to 2006 the ratio of women sharply rose approximately 20% to 32%. In 2001 to 2007. The ratio of individual men boosted from approximately 18% to […]

The chart below shows the percentage of people who ate five portions of fruit and vegetables per day in the UK from 2001 to 2008.

The chart illustrates the proportion of people who consumed five portions of fruits and vegetables each day in the United Kingdom between 2001 and 2008. Overall, it is evident that the largest percentage of women ate fruits and vegetables, while the opposite was true for children. Generally, this figure rose gradually in three generations over […]

The chart below shows the percentage of people who ate five portions of fruit and vegetables per day in the UK from 2001 to 2008.

The graph provided illustrates to us the percentage of people in the UK who haf five portions of fruit and vergetables per one day during the period in between 2001 to 2008. Overall, women consumed the five portions of fruit and vegetables the most in every given years followed by men and children in order. […]

The chart below shows the percentage of people who ate five portions of fruit and vegetables per day in the UK from 2001 to 2008.

The bar chart illustrates the proportion of women, men and children consuming five servings of fruit and vegetables each day in 8 years from 2001 to 2008 in the UK. Overall, it can be seen that the highest percentage of all people consuming fruit and vegetables was women, while children consistently accounted for the lowest […]

See All

Other Topics:

The chart below shows the number of jobs in tourism-related industries in on UK city between 1989 and 2009. (

The bar chart gives information about the number of jobs in four different tourism-related industries in a city in the UK from 1989 to 2009. Overall, restaurants and housing generally experienced upward trends, while travel and tours declined significantly. Noticeably, the number of jobs in restaurants was mostly the highest throughout the period shown, while […]

The chart below shows the results of three surveys on absenteeism in a particular European country in the years 2000, 2005, and 2010. The results show the reasons people gave for not going to work.

The bar chart compares the outcomes of three different surveys, which show the main reasons for absenteeism in a particular European country in 2000, 2005 and 2010. Overall, although illness experienced a considerable decline, it still remained as the most widespread reason for absenteeism. While stress and unexpected problems related to traffic and weather conditions […]

The graph below shows the sales of 5 types of items in four different seasons in a US department store in 2011.

The line graph compares the sales of five different types of items – women’s clothes, men’s clothes, sports equipment, cosmetics, and jewellery – in four seasons ( Winter, Spring, Summer, and Autumn) in a US department store in 2011. Overall, women’s clothes stand out as the highest sold item among others, while men’s clothes were […]

The bar graph below shows the number of new houses constructed in a certain city from between 1999 and 2002. Summarise the information by selecting and reporting the main features, and make comparisons where relevant.

The bar chart illustrates changes in the number of new houses constructed in a certain city between 1999 and 2002. The figures are given in numbers of houses. Overall, detached houses and terrace houses showed an upward trend, whereas semi-detached houses and flats declined over the period. It is also noticeable that detached houses recorded […]

The charts below show the percentage of male and female students of different age groups who studied in Australia for full-time and part-time education in 2006. Summarize the information by selecting and reporting the main features, and make comparisons where relevant.

The bar charts compare the proportion of students of both genders in different age brackets who studied full-time and part-time in Australia in 2006. Overall, while part-time education was more prevalent among students aged 24 and under, those over 25 primarily opted for full-time education. Moreover, the figure for female attendance was generally higher than […]

The bar chart below compares the main modes of transport used by people to travel to work in London in 2000 and 2020. Summarise the information by selecting and reporting the main features, and make comparisons where relevant.

The bar chart compares the primary methods of transportation utilized by commuters to travel to work in London across the years 2000 and 2020. Overall, while driving a car remained the most dominant mode of travel throughout the period, its share declined. Conversely, public transport and cycling experienced upward trends, whereas walking rates remained entirely […]

See All
We have detected unusual activity on your device.
Please verify your identity to continue.
Note: This verification step won't sign you in. If you have a premium account, please log in to access the service as usual.
Google/Gmail Verification
Or verify using Email/Code
We've sent a verification code to:
youremail@gmail.com (Not your email?)
Enter it below to complete the verification process.
Ensure your email address is correct, your inbox is not full, and you check your spam folder. If no email arrives, consider using an alternative email.
You will need a Premium plan to perform your action!
Note: If you already have a premium account, please log in to access our services as usual.

Plans & Pricing

Our mission is to make quality education accessible for everyone.
However, to keep our hardworking team running and this service alive, we genuinely need your support!
By opting for a premium plan, not only do you sustain us in achieving the mission, but you also unlock advanced features to enrich your learning experience.

Free

For learners who aren't pressed for time

What's included on Free
100+ Cambridge IELTS Tests
Instant IELTS Writing Task 1 & 2 Evaluation (2 times/month)
Instant IELTS Speaking Part 1, 2, & 3 Evaluation (2 times/month)
Instant IELTS Writing Task 1 & 2 Essay Generator (2 times/month)
500+ Dictation & Shadowing Exercises
100+ Pronunciation Exercises
Flashcards
Other Advanced Tools

Premium

For those serious about advancing their English proficiency, and for IELTS candidates aspiring to boost their band score by 1-2 points (especially in writing & speaking) in just 30 days or less

What's included on Premium
Save Your IELTS Test Progress & Analyze Mistakes By Question Type
Save Your Own Flashcard Sets & Use Them On Any Device
Unlock All Courses, IELTS Tests, Section & Part Practice
Unlimited AI Conversations
Unlimited AI Writing Enhancement Exercises
Unlimited IELTS Writing Task 1 & 2 Evaluation
Unlimited IELTS Speaking Part 1, 2, & 3 Evaluation
Checked Answers Will Not Be Published
Unlimited IELTS Writing Task 1 & 2 Essay Generator
Unlimited IELTS Speaking Part 1, 2, & 3 Sample Generator
Unlimited Usage Of Advanced Tools & AI Features
Priority Support within 24h (12-month plan only)

Due to the nature of our service and the provided free trials, payments are non-refundable.