Our system will evaluate the answer based on this AI-generated description.
The image presents a bar chart detailing US household expenditure (in billions) from 2000 to 2007 across three categories: Groceries, Electricity, and Internet. In 2000, Groceries reached nearly $60 billion, Electricity around $30 billion, and Internet approximately $5 billion. In 2001, Groceries remained at about $60 billion, Electricity slightly below $40 billion, and Internet slightly above $5 billion. By 2002, Groceries were close to $60 billion, Electricity around $40 billion, and Internet under $10 billion. In 2003, Groceries again near $60 billion, Electricity just above $40 billion, and Internet just above $10 billion. In 2004, Groceries maintained at about $60 billion, Electricity just under $50 billion, and Internet about $15 billion. 2005 saw Groceries still near $60 billion, Electricity at roughly $50 billion, and Internet nearing $20 billion. In 2006, Groceries close to $60 billion, Electricity just over $50 billion, and Internet slightly below $20 billion. By 2007, Groceries were around $60 billion, Electricity slightly over $50 billion, and Internet close to $20 billion.
Given the complexity of the image, the above description may not be entirely accurate.
Skyrocket your IELTS band score by 1-2 points in under a month with our premium plan!
Note: Both the topic and the answer were created by one of our users.
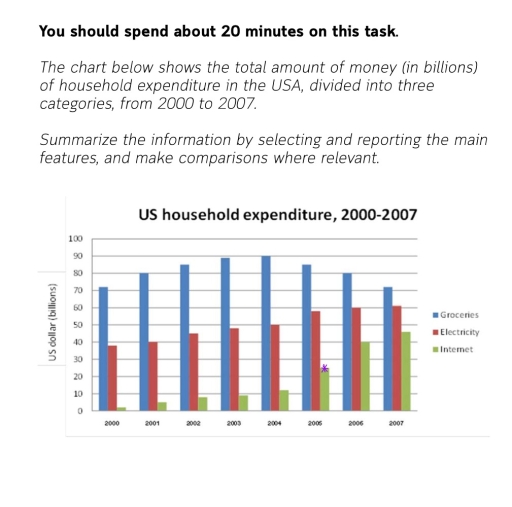
The bar chart illustrates the information of the money spent by US resident on different type off household expenditure between 2000 and 2007.
It is immediately remarkable that spending on the groceries was the highest thought out the period given. Rising from 72 US billion dollars to just under 90 US billon dollars, after peaking at 90 US billion dollars the following year. This expense had fallen back to the 2000 figure by 2007.
In the other hand, expense on the electricity was a dramatic increase approximately from 38 billion to 62 billion. Moreover there was rose steadily in the last two year of the period. For spending on the internet, increase significantly from 2 billion in 2000 to 45 billion in 2007.
Overall, although the expense on groceries was still highest in the period, the gap of three categories narrowed noticeably in the second part of the period shown.
Word Count: 150
