Our system will evaluate the answer based on this AI-generated description.
The image displays a bar chart of Finland's telephone calls from 1995 to 2004, in million minutes: in 1995, local-landline at 12000, national and international-landline at 6000, mobiles at 2000; 1996, local-landline at 12500, national and international-landline at 6200, mobiles at 2500; 1997, local-landline at 13000, national and international-landline at 6300, mobiles at 3000; 1998, local-landline at 14000, national and international-landline at 6500, mobiles at 5000; 1999, local-landline at 15000, national and international-landline at 6900, mobiles at 7000; 2000, local-landline at 16000, national and international-landline at 7300, mobiles at 9000; 2001, local-landline at 17000, national and international-landline at 7400, mobiles at 11500; 2002, local-landline at 17000, national and international-landline at 7500, mobiles at 13000; 2003, local-landline at 16500, national and international-landline at 7800, mobiles at 14000; 2004, local-landline at 14500, national and international-landline at 7800, mobiles at 15000.
Given the complexity of the image, the above description may not be entirely accurate.
Skyrocket your IELTS band score by 1-2 points in under a month with our premium plan!
Note: Both the topic and the answer were created by one of our users.
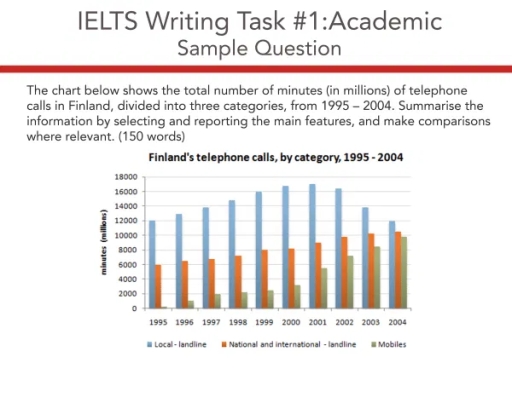
The bar chart illustrates the amount of telephone calls taken and calculated by the total number of minutes (in millions) in Finland, seperated into three groups of rates from 1995 – 2004.
Overall, local landline receives the greatest number of mintues in 2001. In comparison, by 1995, mobiles had the lowest amount of mintues (in millions) because there were fewer mobiles in use during that period
In more detail, between 1999 and 2000, national and international – landline had a slight identical amount of 8000 and 8001 million minutes. However, during 2002, the usage of mobiles started to grow upto 7000 million and in 2004, as new investments got added in, the amount increased to 9999 million-minute total.
Furthermore, throughout the 10 years, the demand for local – landline has the highest rank of all the time compared to other telephone calls. Meanwhile, in 2002, the value for local – landline displayed slower, irregular growth upto 2004, which it got declined to 12000 million.
Word Count: 164
