🔥 Today Only: Save 30% on Premium — Offer Ends Soon! - Upgrade Now!
Bar Chart

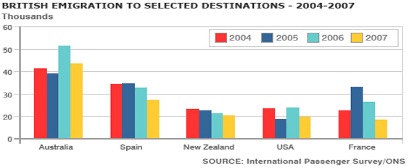
Band 6+: The chart shows British Emigration to selected destinations between 2004 and 2007.

Image for topic: The chart shows British Emigration to selected destinations between 2004 and 2007.
Our system will evaluate the answer based on this AI-generated description.
The image depicts a bar graph illustrating British emigration to selected destinations between 2004-2007, with thousands on the y-axis and destination countries on the x-axis. Each country has four bars representing the years, with blue for 2004, red for 2005, green for 2006, and yellow for 2007. Australia had the highest emigration numbers, starting around 50,000 in 2004, decreasing steadily each year to just over 30,000 in 2007. Spain's numbers ranged from just over 40,000 in 2004 to around 35,000 in 2007. New Zealand saw a consistent decrease from just over 20,000 in 2004 to around 10,000 in 2007. The USA had an increase from 20,000 in 2004 to nearly 30,000 in 2006 before dropping to around 20,000 in 2007. France's numbers remained relatively stable, starting at just over 10,000 in 2004, peaking at around 15,000 in 2005, and settling at just under 10,000 in 2007. The data source is the International Passenger Survey/ONS.
Given the complexity of the image, the above description may not be entirely accurate.
Note: Both the topic and the answer were created by one of our users.

The bar chart presents British Emigration to five different destinations, namely Australia, Spain, New Zealand, USA and France, for the years between 2004 and 2007.

Overall, it is clear from the graph that Australia was the most popular destination every year, followed by Spain. New Zealand and the USA are more or less similar in popularity, while France was slightly above them on average.

If we take a look at Australia, we can see that around 40 thousand british people emigrated here every year, except 2006, when this number was more than 50 thousand. On the other hand, the two countries with the lowest rates had around 20 thousand people, which is significantly lower.

According to the chart, the amount of people choosing a destination was similar over the years, in all cases, however it is interesting to note that there are two noticable outliers. In the afformentioned year 2006, Australia had 50 thousand British emigrants, which is around 10 thousand more, than the other years. The other outlier is France in 2005, having more than 30 thousand emigrants compared to the usual 20-25 thousand.

Word Count: 185

Answers On The Same Topic:

The chart shows British Emigration to selected destinations between 2004 and 2007.

The provided bar graph illustrates the patterns of British emigration to various selected countries over a four-year period from 2004 to 2007. Overall, it is evident that while Australia consistently led in the number of emigrants, most other destinations experienced varying trends, either declining or remaining stable throughout the timeframe. Specifically, Australia saw the highest […]

The chart shows British Emigration to selected destinations between 2004 and 2007.

The bar chart shows the number of British people who emigrated to five destinations over the period 2004 to 2007. It is evident from the chart that throughout the period, the most popular place to move to was Australia. Emigration to Australia stood at just over 40,000 people in 2004, which was approximately 6,000 higher […]

The chart shows British Emigration to selected destinations between 2004 and 2007.

The bar chart shows the number of British people who emigrated to five destinations over the period 2004 to 2007. It is evident from the chart that throughout the period, the most popular place to move to was Australia. Emigration to Australia stood at just over 40,000 people in 2004, which was approximately 6,000 higher […]

The chart shows British Emigration to selected destinations between 2004 and 2007.

The bar chats illustrates number of British masses are emigration from five different nations between 2004 to 2007. After analyzing the bar ghaph, In 2004 and 2005, there was negligible difference by people to Australia.Moreover, the noticably different by 7000 individuals are emigration to first country.furthermore,the second major nation is Spain with almost identical percent […]

The chart shows British Emigration to selected destinations between 2004 and 2007.

The bar chats illustrates number of British masses are emigration from five different nations between 2004 to 2007. After analyzing the bar ghaph, In 2004 and 2005, there was negligible difference by people to Australia.Moreover, the noticably different by 7000 individuals are emigration to first country.furthermore,the second major nation is Spain with almost identical percent […]

See All

Other Topics:

The bar chart shows the average class size in primary schools and lower secondary schools in 6 countries compared to the world average in 2006. Summarize the information by selecting and reporting the main features, and make comparisons where relevant

The given glance illustrates the average class size in six countries and compares it with the world average class size in 2006 Firstly, South Korea had highest number of students in primary school it was 33, While lower secondary school number of students relatively high and it was 36. Moreover, Japan and UK number of […]

The chart below shows the global sales of different kinds of digital games from 2000 to 2006.

The bar chart illustrates the international sales of different types of electronic games from 2000 to 2006 in dollars. Overall, it is observed that handheld games was constantly the bestseller, while the sales of online games increased while console game decreased. To begin with, there was no existence of the mobile phone games in the […]

The bar chart below shows government funding for different types of arts and cultural activities in three countries in 2022. Summarise the information by selecting and reporting the main features, and make comparisons where relevant.

A bar chart is given showing government funding for different type of arts and cultural activities in three countries in 2022. Colors are used to portray different countries, for instance: Blue bar is used for Country A, and Green bar for Country B and Yellow bar for Country C. The x-axis shows different type of […]

The graph below shows the number of enquiries received by the Tourist Information Office in one city over six-month period in 2011

“The line chart illustrates the quantity of enquiries received by the tourist information office through three different methods, including in person, by letter/email, and by telephone over six months in 2011 Overall, it can be clearly seen that the quantity of enquiries in person increased significantly over the period, while the enquiries by letter/email declined […]

The bar graph illustrates the proportion of English and Welsh house owners and tenants from 1918 to 2011.

The chart shows the percentage of households owned and rented accommodation in England and Wales between 1918 and 2011. The pie chart shows the households in owned accommodation in again measured from 1918 to 2011. Both households that in rented accommodation decreased from 1918 to 2011. The highest households in owned accommodation is in the […]

The chart below shows the proportions of the world’s oil resources held in different areas, together with the proportions consumed annually in the same areas.

Two charts give data about proportions of the world’s oil resources held in different parts of the word, together with the information about certain proportions consumed annually in the same areas. Overall, the highest percentage of held oil recourses held is sown to be in Middle East, by 56.52%. Asia and United States both are […]

See All
We have detected unusual activity on your device.
Please verify your identity to continue.
Note: This verification step won't sign you in. If you have a premium account, please log in to access the service as usual.
Google/Gmail Verification
Or verify using Email/Code
We've sent a verification code to:
youremail@gmail.com (Not your email?)
Enter it below to complete the verification process.
Ensure your email address is correct, your inbox is not full, and you check your spam folder. If no email arrives, consider using an alternative email.
You will need a Premium plan to perform your action!
Note: If you already have a premium account, please log in to access our services as usual.

Plans & Pricing

Our mission is to make quality education accessible for everyone.
However, to keep our hardworking team running and this service alive, we genuinely need your support!
By opting for a premium plan, not only do you sustain us in achieving the mission, but you also unlock advanced features to enrich your learning experience.

Free

For learners who aren't pressed for time

What's included on Free
100+ Cambridge IELTS Tests
Instant IELTS Writing Task 1 & 2 Evaluation (2 times/month)
Instant IELTS Speaking Part 1, 2, & 3 Evaluation (2 times/month)
Instant IELTS Writing Task 1 & 2 Essay Generator (2 times/month)
500+ Dictation & Shadowing Exercises
100+ Pronunciation Exercises
Flashcards
Other Advanced Tools

Premium

For those serious about advancing their English proficiency, and for IELTS candidates aspiring to boost their band score by 1-2 points (especially in writing & speaking) in just 30 days or less

What's included on Premium
Save Your IELTS Test Progress & Analyze Mistakes By Question Type
Save Your Own Flashcard Sets & Use Them On Any Device
Unlock All Courses, IELTS Tests, Section & Part Practice
Unlimited AI Conversations
Unlimited AI Writing Enhancement Exercises
Unlimited IELTS Writing Task 1 & 2 Evaluation
Unlimited IELTS Speaking Part 1, 2, & 3 Evaluation
Checked Answers Will Not Be Published
Unlimited IELTS Writing Task 1 & 2 Essay Generator
Unlimited IELTS Speaking Part 1, 2, & 3 Sample Generator
Unlimited Usage Of Advanced Tools & AI Features
Priority Support within 24h (12-month plan only)

Due to the nature of our service and the provided free trials, payments are non-refundable.