Our system will evaluate the answer based on this AI-generated description.
The image presents a bar chart displaying the number of US households in millions, segmented by annual income for the years 2007, 2011, and 2015. Five income brackets are represented: Less than $25,000; $25,000-$49,999; $50,000-$74,999; $75,000-$99,999; $100,000 or more. In 2007, households earning less than $25,000 numbered 25 million, $25,000-$49,999 had 30 million, $50,000-$74,999 with 20 million, $75,000-$99,999 captured 15 million, and $100,000 or more included 10 million households. In 2011, numbers slightly decreased for the first three brackets to 23, 28, and 18 million respectively, while the last two brackets increased to 17 and 12 million respectively. By 2015, the less than $25,000 bracket further decreased to 20 million, $25,000-$49,999 reduced to 25 million, $50,000-$74,999 remained at 18 million, $75,000-$99,999 increased to 20 million, and $100,000 or more saw significant growth to 25 million households.
Given the complexity of the image, the above description may not be entirely accurate.
Skyrocket your IELTS band score by 1-2 points in under a month with our premium plan!
Note: Both the topic and the answer were created by one of our users.
This is an answer written by a candidate who achieved a Band 5.5 score.
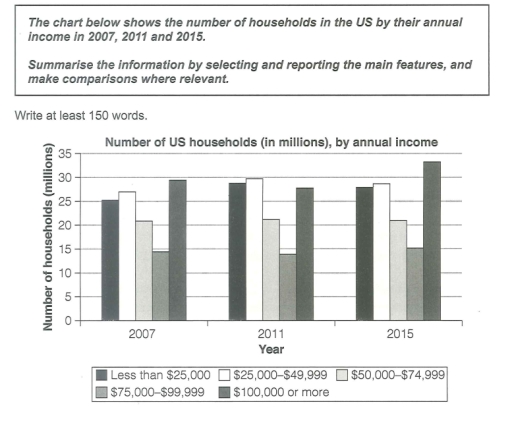
The graph illustrats the data of different levels of annual wage of families in the united states in 2007, 2011 and 2015.
As far as the number of families whose annual income was less than $25,000, it began with around >5 million in 2007, then increased to approximately 27 million in 2011, but decreased by 2 million 4 years later. Similarly, those of families that earned $25,000 to $49,999 were about 25 million in 2007, after that it rose to nearly 30 million in 2011. Finally it decreased to around 27 million in 2015.
By contrast, the groups of families which have high income, including $75,000 to $99.999 and $100,000 or more, experienced a drop in 2011, but their data went up in 2015.
Interesting things could be seen in the group of middle income, the data remain the same in 2007, 2011 and 2015.
Word Count: 159