Our system will evaluate the answer based on this AI-generated description.
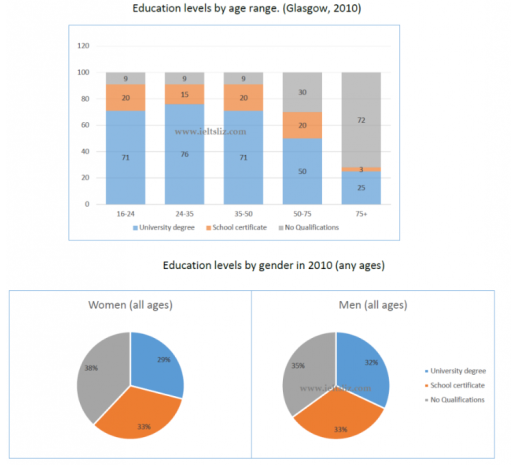
The image shows two graphs about education levels in Glasgow in 2010: a bar chart displaying education levels by age range and a pie chart showing education levels by gender. In the bar chart, for the 16-24 age range, 9% have a university degree, 71% have a school certificate, and 20% have no qualifications; for 24-35, 15% have a degree, 76% have a certificate, and 9% have no qualifications; for 35-50, 20% have a degree, 71% have a certificate, and 9% have no qualifications; for 50-75, 20% have a degree, 50% have a certificate, and 30% have no qualifications; for 75+, 3% have a degree, 25% have a certificate, and 72% have no qualifications. In the pie chart, for women, 38% have a degree, 29% have a certificate, and 33% have no qualifications, while for men, 35% have a degree, 32% have a certificate, and 33% have no qualifications.
Given the complexity of the image, the above description may not be entirely accurate.
Skyrocket your IELTS band score by 1-2 points in under a month with our premium plan!
Note: Both the topic and the answer were created by one of our users.
The bar chart and pie charts give information regarding the percentage of people divided by age range of those who had university, school degree and no qualifications. Data was observed by two genders in pie charts.
Overall, the majority of people with university degree were in younger age group, whereas population without qualifications had more old generation. The proportion of men and women were similar and witnessed a negligible difference.
University degree had 71% or more people aged 16-50 years, 50% and less had the category of people from 50-75+. On the contrary, the latter showed a reverse in terms of no qualifications from 72% to 30% of elderly. The former had only 9% of younger without qualifications. Approximately 20% of people from 16-75 had school certificate, but only 3% of elderly over 75’s had the school sertificate.
The proportion of men and women in each level was around one third. Men were superior by 3% with university degree and similarly women without education qualifications.
Word Count: 165
