🔥 Today Only: Save 30% on Premium — Offer Ends Soon! - Upgrade Now!
Line Graph

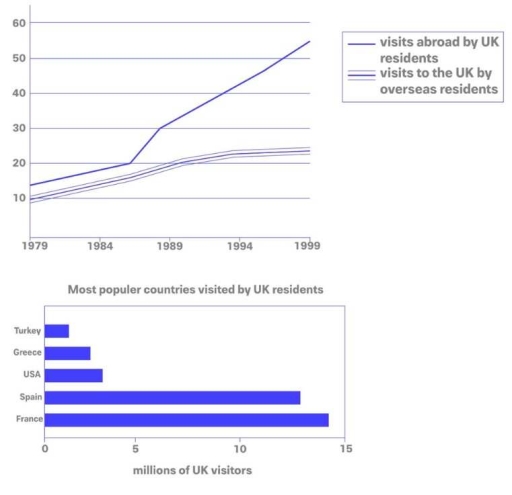
Band 7+: The charts below give information about travel to and from the UK, and about the most popular countries for UK residents to visit.

Image for topic: The charts below give information about travel to and from the UK, and about the most popular countries for UK residents to visit.
Our system will evaluate the answer based on this AI-generated description.
The image contains two graphs related to travel by UK residents. The first graph is a line graph with two lines representing 'visits abroad by UK residents' and 'visits to the UK by overseas residents' from 1979 to 1999. The 'visits abroad by UK residents' line shows a steady increase starting at about 10 million in 1979, surpassing 20 million around 1986, reaching 30 million between 1989 and 1990, and surpassing 50 million just before 1999. The 'visits to the UK by overseas residents' line also shows an increase but at a slower rate, starting below 10 million in 1979, reaching approximately 10 million between 1984 and 1985, surpassing 20 million just before 1994, and hitting nearly 30 million in 1999. The second graph is a bar chart titled 'Most popular countries visited by UK residents' showing five countries with varying lengths of bars representing 'millions of UK visitors'. France has the longest bar with over 10 million visitors, followed by Spain with just under 10 million. The USA has a bar representing just over 5 million visitors, Greece has a shorter bar indicating fewer visitors, and Turkey has the shortest bar with the least number of visitors amongst the listed countries, not surpassing 2 million.
Given the complexity of the image, the above description may not be entirely accurate.
Note: Both the topic and the answer were created by one of our users.

The charts highlight the numbers for visitors to and from the UK as well as five most common countries that UK people visited.

Overall, it can be seen that both travel directions witnessed an upward trend, in particular the ones leaving UK. Additionally, the most visited countries by UK residents were nearby countries, such as France compared to the least popular ones which are located far away.

In 1979, the number of people traveling from the UK increased to 20 million, after which it surged to 30 millions. Then, the figure kept growing, until it peaked at around 55 million, in 1999. Similarly, visits to the UK by overseas tourists rose at steady intervals throughout the period as well but to a much lesser extent: the statistics more than doubled from 10 million at the beginning to roughly 20 million by the end.

In terms of the most preferred countries by UK residents, France and Spain were leading with approximately 14 and 13 million visitors, respectively. The remaining countries were visited by around 9 million UK individuals all together with Turkey being the least popular.

Word Count: 185

Answers On The Same Topic:

The charts below give information about travel to and from the UK, and about the most popular countries for UK residents to visit.

The line graph illustrates the number of visits made by UK residents to other countries, as well as visits to the UK by overseas visitors, over a 20-year period ending in 1999. The bar chart compares the most popular countries visited by UK residents in 1999. Viewed together, there appears to be a connection between […]

The charts below give information about travel to and from the UK, and about the most popular countries for UK residents to visit.

The linear graph provide information of the UK residents traveled to visit abroad to and the visitors coming in the UK for visits. The bar graph illustrates about most popular regions enters by the British residents in the year 1999. Considering from an overall perspective, it can be comprehensively observed that British resident individuals visits […]

The charts below give information about travel to and from the UK, and about the most popular countries for UK residents to visit.

The line graph illustrates the number of visits to and from the UK between 1979 and 1999, while the bar chart shows the five most popular destinations visited by UK residents in 1999. Viewed together, the figures indicate a strong relationship between the growth in outbound travel and the concentration of visits in a limited […]

The charts below give information about travel to and from the UK, and about the most popular countries for UK residents to visit.

The line graph illustrates the number of visits to and from the UK between 1979 and 1999, while the bar chart shows the most popular countries visited by UK residents in 1999. Overall, both overseas visits to the UK and trips abroad by UK residents increased over the period, but UK residents travelling abroad grew […]

The charts below give information about travel to and from the UK, and about the most popular countries for UK residents to visit.

the mix charts percents information about internatinal travel by uk and visitors in the Uk from 1969 to 1989. Overall, it is clear that both residents increased over the period. Among the most popular destination, France was the most favored choice of Uk tourists, while Turkey was the levod cammon. In detail, visits abroad by […]

See All

Other Topics:

The graph below shows the amounts of waste produced by three companies over a period of 15 years. Summarise the information by selecting and reporting the main features and make comparisons where relevant. You should write at least 150 words.

The provided graph depicts the proportion of how much wasted were produced by three companies from 2000 to 2015. Units are measured in tonnes. Overall, blue company accounted for the highest number of wasted, before the number drop in the final year and took over by yellow company. Green company on the other hand, experienced […]

The graph shows the percentage of visiting the cinema once a month or more between 1984 to 2003 (4 age groups) Summarise the information by selecting and reporting the main features, and make comparisons where relevant.

The given graph illustrates the proportion of different age groups visiting the cinema once a month or more from 1984 to 2003. Overall, what is most striking when looking at the data is that the percentage of all age groups increased remarkably, with the most substantial rise in 15-24. Additionally, the age group from 15-24 […]

The chart below shows the percentage of households with different kinds of technology in the UK from 1997 to 2001. Summarise the information by selecting and reporting the main features, and make comparisons where relevant.

The line graph represents the rate of households in the UK owning five different electronic gadgets between 1997 and 2001. Overall, all the technologies showed the increase all over the period. Despite the growth of various gadgets, CD player and telephone composed the highest measures. In 1997, DVD player stood roughly at 27%, which was […]

The chart below shows the percentage of households with different kinds of technology in the UK from 1997 to 2001. Summarise the information by selecting and reporting the main features, and make comparisons where relevant.

The graph illustrates the percentage of households with different types of technology in the UK between 1997 and 2001. Overall, it is true that the illustration provides the development of the percentage of the different households. CD player was widely used at the beginning and it demonstrated the highest proportion among other kinds of technology […]

The graph illustrates trendsin music buying habits between 2011 and 2018.

The presented line graph depics the trends in music purchasing hobbies from streams, downloads, CDs over the period of seven years, starting from 2011. Overall, it is evident that the trends in stream witnessed an upward trend, the opposite was true for downloads and CDs. Remarkably, CDs was the most popular trend in music habits […]

THE GRAPH BELOW SHOWS THE UNEMPLOYMENT RATES IN THREE COUNTRIES FROM 1990 TO 2004

The given graph represents the less opportunity ratio of people in the three nations UK, USA and Japan from1990 to 2004 0ver the duration of 14 years and unit is measured in the percentage. As an overall trend, it can be seen that the the ratio of unemployment in Japan decreased from the 1990 to […]

See All
We have detected unusual activity on your device.
Please verify your identity to continue.
Note: This verification step won't sign you in. If you have a premium account, please log in to access the service as usual.
Google/Gmail Verification
Or verify using Email/Code
We've sent a verification code to:
youremail@gmail.com (Not your email?)
Enter it below to complete the verification process.
Ensure your email address is correct, your inbox is not full, and you check your spam folder. If no email arrives, consider using an alternative email.
You will need a Premium plan to perform your action!
Note: If you already have a premium account, please log in to access our services as usual.

Plans & Pricing

Our mission is to make quality education accessible for everyone.
However, to keep our hardworking team running and this service alive, we genuinely need your support!
By opting for a premium plan, not only do you sustain us in achieving the mission, but you also unlock advanced features to enrich your learning experience.

Free

For learners who aren't pressed for time

What's included on Free
100+ Cambridge IELTS Tests
Instant IELTS Writing Task 1 & 2 Evaluation (2 times/month)
Instant IELTS Speaking Part 1, 2, & 3 Evaluation (2 times/month)
Instant IELTS Writing Task 1 & 2 Essay Generator (2 times/month)
500+ Dictation & Shadowing Exercises
100+ Pronunciation Exercises
Flashcards
Other Advanced Tools

Premium

For those serious about advancing their English proficiency, and for IELTS candidates aspiring to boost their band score by 1-2 points (especially in writing & speaking) in just 30 days or less

What's included on Premium
Save Your IELTS Test Progress & Analyze Mistakes By Question Type
Save Your Own Flashcard Sets & Use Them On Any Device
Unlock All Courses, IELTS Tests, Section & Part Practice
Unlimited AI Conversations
Unlimited AI Writing Enhancement Exercises
Unlimited IELTS Writing Task 1 & 2 Evaluation
Unlimited IELTS Speaking Part 1, 2, & 3 Evaluation
Checked Answers Will Not Be Published
Unlimited IELTS Writing Task 1 & 2 Essay Generator
Unlimited IELTS Speaking Part 1, 2, & 3 Sample Generator
Unlimited Usage Of Advanced Tools & AI Features
Priority Support within 24h (12-month plan only)

Due to the nature of our service and the provided free trials, payments are non-refundable.