Our system will evaluate the answer based on this AI-generated description.
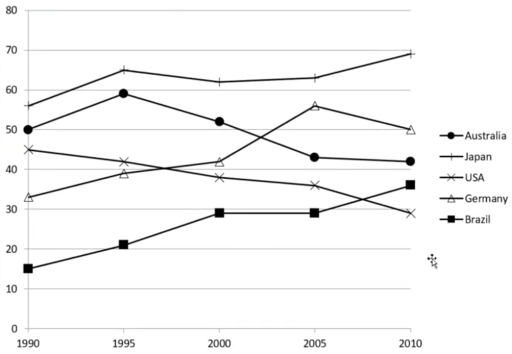
The image displays a line graph with data points for five countries from 1990 to 2010 at 5-year intervals. For Australia in 1990, 1995, 2000, 2005, and 2010, the values roughly are 50, 55, 65, 70, and 70. Japan starts around 50 in 1990, approximates 60 in 1995, around 45 in 2000, near 40 in 2005, and about 45 in 2010. The USA values are close to 30 in 1990, just over 40 in 1995, dips slightly below 40 in 2000, climbs to approximately 45 in 2005, and reaches around 50 in 2010. Germany begins at about 20 in 1990, goes up to 30 in 1995, increases to 40 in 2000, just over 45 in 2005, and 40 in 2010. Brazil starts near 5 in 1990 and has values around 10 for 1995, 2000, 2005, and 2010. Each line chart uses a different symbol to represent the country, and the axis ranges from 0 to 80 on the vertical scale, while the horizontal scale represents the years from 1990 to 2010.
Given the complexity of the image, the above description may not be entirely accurate.
Skyrocket your IELTS band score by 1-2 points in under a month with our premium plan!
Note: Both the topic and the answer were created by one of our users.
The line graph provides data about how satisfaction with the education system in Australia, Japan, Germany, Brazil, and the U.S.A. changed over a 20-year period, starting from 1990.
Overall, it can be seen that the percentage of people who were satisfied with the education system in Brazil, Germany, and Japan increased, whereas it decreased in Australia and the U.S.A. Further, satisfaction levels in Japan were consistently higher over the period shown.
Looking at the data in more detail, it is evident that the level of satisfaction with the education system stood at about 55% in 1990. Following this trend, by 2010, it had risen to 59%, which was the highest point on the chart. However, the proportion of people who were satisfied with the education system in Germany and Brazil showed a similar trend, rising from around 33% and 15% to 50% and 36% in 1990 and 2010, respectively. Brazil experienced the greatest increase of all countries.
Word Count: 157
