🔥 Today Only: Save 30% on Premium — Offer Ends Soon! - Upgrade Now!
Bar Chart

Band 6+: The charts below show the amount of money spent on advertising in the UK and Australia across five different media types in 2010 and 2020. Summarise the information by selecting and reporting the main features, and make comparisons where relevant.

Image for topic: The charts below show the amount of money spent on advertising in the UK and Australia across five different media types in 2010 and 2020. Summarise the information by selecting and reporting the main features, and make comparisons where relevant.
Our system will evaluate the answer based on this AI-generated description.
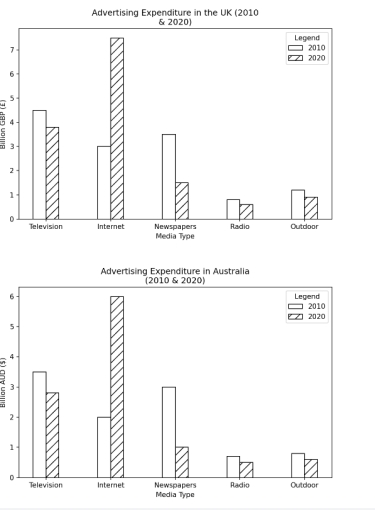
The image features two vertical bar charts comparing advertising expenditure across five media types (Television, Internet, Newspapers, Radio, Outdoor) in 2010 (solid white bars) and 2020 (diagonal-striped bars). The top chart, titled "Advertising Expenditure in the UK (2010 & 2020)", with the y-axis measuring "Billion GBP (£)" from 0 to 7+, shows 2010 and 2020 expenditures respectively: Television at ~4.5 and ~3.8 billion GBP; Internet at 3.0 and ~7.5 billion GBP; Newspapers at 3.5 and 1.5 billion GBP; Radio at ~0.8 and ~0.6 billion GBP; and Outdoor at ~1.2 and ~0.9 billion GBP. The bottom chart, titled "Advertising Expenditure in Australia (2010 & 2020)", with the y-axis measuring "Billion AUD ($)" from 0 to 6, displays 2010 and 2020 values: Television at 3.5 and ~2.8 billion AUD; Internet at 2.0 and 6.0 billion AUD; Newspapers at 3.0 and 1.0 billion AUD; Radio at ~0.7 and 0.5 billion AUD; and Outdoor at ~0.8 and ~0.6 billion AUD.
Given the complexity of the image, the above description may not be entirely accurate.
Note: Both the topic and the answer were created by one of our users.

The charts depict information about the amount of monet spent on advertising in the UK and Australia across television, internet, newspapers, radio, and outdoor in 2010 and 2020.

Overall, people spent more amount of money on advertising internet compared to other media types both in the UK and Australia.

In the UK, in 2010, nearly £4.6 billion spent on advertising television, while it decreased to just below £4 billion in 2020. Internet was the most popular media types, in 2010 £3 billion and in 2020, it became more known, just above £7 billion was spent on advertising it. In 2010, approximately £3.5 billion and in 2020, nearly £1.5 billion was spent on advertising newspapers. Both in 2010 and 2020, just below £1 billion was spent on radio, while in 2010, just above £1 billion and in 2020, £1 billion was spent on advertising outdoor.

In Australia, in 2010 $3.6 billion, and in 2020, just below $3 billion was spent on advertising television. In 2010 $2 billion spent on advertising internet, while it increased to $6 billion in 2o2o. In 2010, $3 billion was spent on advertising newspapers, which ended up decreasing to $1 billion in 2020. Both in 2010 and 2020, just below $1 billion was spent on advertising radio and outdoor.

Word Count: 212

Answers On The Same Topic:

The charts below show the amount of money spent on advertising in the UK and Australia across five different media types in 2010 and 2020. Summarise the information by selecting and reporting the main features, and make comparisons where relevant.

Two bar charts illustrate the money spent on five distict media types in the UK and Australia, for 2010 and 2020. Overall both countries showed same spending patterns, in 2010 television accounted for the greatest expenditure and in 2020 the biggest expense was internet advertisement for the countries. In 2010, advertising mediums in the UK […]

The charts below show the amount of money spent on advertising in the UK and Australia across five different media types in 2010 and 2020. Summarise the information by selecting and reporting the main features, and make comparisons where relevant.

The charts compare information about advertising expenditure across television,internet,newspapers,radio and outdoor in Australia and UK in 2010 and 2020 years. Overall,for both Australia and the UK,spending on the internet was highest in 2020,whereas the amount of money spent on radio was lowest for both years in both countries. In Australia,in 2010,$ 3,5 billion dollars were […]

The charts below show the amount of money spent on advertising in the UK and Australia across five different media types in 2010 and 2020. Summarise the information by selecting and reporting the main features, and make comparisons where relevant.

These bar charts compare advertising expenditure across five different media types in the UK and Australia in 2010 and 2020, with figures given in billions of GBP and AUD, respectively. Overall, it is clear that Television advertising recorded the highest expenditure in both regions in 2010. Notably, in 2020, the amount of money spent on […]

See All

Other Topics:

You are given a stacked bar chart that displays quarterly sales by product category. Analyse the sales trends accross different quarters and compare the performance of product categories

The stacked bar graph compares the number of total sales in four quarters of three different products A, B and, C , in the year 2020. Overall, it is clear that product A had the highest sales in 3rd quarter, while in the fourth quarter product B had mojority of sales as compared to product […]

the chart shows information about the actual and expected figures of population in three cities

The bar chart illustrates the populations of three cities in 1990, and their predicted and actual figures for 2000. Overall, population of three cities increased over the period. Sao Paulo recorded the largest population, while Jakarta had the smallest population throughout the period. In addition, the actual number of population exceeded the predicted number in […]

the chart shows information about the actual and expected figures of population in three cities

The bar chart illustrates the populations of three cities in 1990, and their predicted and actual figures for 2000. Overall, in three cities populations increased over the period. Sao Paulo recorded the largest population, while Jakarta had the smallest population throughout the period. In addition, the real number of population exceeded predicted number in all […]

Top five activities of Children in Australia and the United Kingdom (2020)

This bar graph, demonstrates the number of children’s extra activities outside of school in UK and Australia in the year 2020. Overall, children in both countries have showed the least interest in the usage of internet. Australian youngers are more likely to have an interest in socialising with friends and playing sports. While, British kids […]

The bar chart and table show information about students from abroad studying in four English-speaking countries in 2004 and 2012.

The provided bar chart and table delineate the number of international students (in thousands) and their proportion relative to the total student population across four English-speaking nations – the USA, the UK, Australia, and Canada – for the years 2004 and 2012. Over the eight-year period, all countries experienced a rise both in the absolute […]

The chart below shows the percentage of male and female teachers in six different types of educational setting in the UK in 2010.

The bar chart compares the percentages of male and female teachers working in six different types of educational institutions in the UK in 2010. Overall, women accounted for the vast majority of teachers in nursery and primary schools, while men were more dominant at universities. The proportions of male and female teachers were almost equal […]

See All
We have detected unusual activity on your device.
Please verify your identity to continue.
Note: This verification step won't sign you in. If you have a premium account, please log in to access the service as usual.
Google/Gmail Verification
Or verify using Email/Code
We've sent a verification code to:
youremail@gmail.com (Not your email?)
Enter it below to complete the verification process.
Ensure your email address is correct, your inbox is not full, and you check your spam folder. If no email arrives, consider using an alternative email.
You will need a Premium plan to perform your action!
Note: If you already have a premium account, please log in to access our services as usual.

Plans & Pricing

Our mission is to make quality education accessible for everyone.
However, to keep our hardworking team running and this service alive, we genuinely need your support!
By opting for a premium plan, not only do you sustain us in achieving the mission, but you also unlock advanced features to enrich your learning experience.

Free

For learners who aren't pressed for time

What's included on Free
100+ Cambridge IELTS Tests
Instant IELTS Writing Task 1 & 2 Evaluation (2 times/month)
Instant IELTS Speaking Part 1, 2, & 3 Evaluation (2 times/month)
Instant IELTS Writing Task 1 & 2 Essay Generator (2 times/month)
500+ Dictation & Shadowing Exercises
100+ Pronunciation Exercises
Flashcards
Other Advanced Tools

Premium

For those serious about advancing their English proficiency, and for IELTS candidates aspiring to boost their band score by 1-2 points (especially in writing & speaking) in just 30 days or less

What's included on Premium
Save Your IELTS Test Progress & Analyze Mistakes By Question Type
Save Your Own Flashcard Sets & Use Them On Any Device
Unlock All Courses, IELTS Tests, Section & Part Practice
Unlimited AI Conversations
Unlimited AI Writing Enhancement Exercises
Unlimited IELTS Writing Task 1 & 2 Evaluation
Unlimited IELTS Speaking Part 1, 2, & 3 Evaluation
Checked Answers Will Not Be Published
Unlimited IELTS Writing Task 1 & 2 Essay Generator
Unlimited IELTS Speaking Part 1, 2, & 3 Sample Generator
Unlimited Usage Of Advanced Tools & AI Features
Priority Support within 24h (12-month plan only)

Due to the nature of our service and the provided free trials, payments are non-refundable.